 AI PPT Maker
 Templates
 PPT Bundles
 Design Services
 Business PPTs
 Business Plan
 Management
 Strategy
 Introduction PPT
 Roadmap
 Self Introduction
 Timelines
 Process
 Marketing
 Agenda
 Technology
 Medical
 Startup Business Plan
 Cyber Security
 Dashboards
 SWOT
SWOT Proposals
 Education
 Pitch Deck
 Digital Marketing
 KPIs
KPIs Project Management
 Product Management
 Artificial Intelligence
 Target Market
 Communication
 Supply Chain
 Google Slides
 Research Services
 One Pagers
 All Categories
Website Data PowerPoint Presentation Templates and Google Slides
33 Item(s)


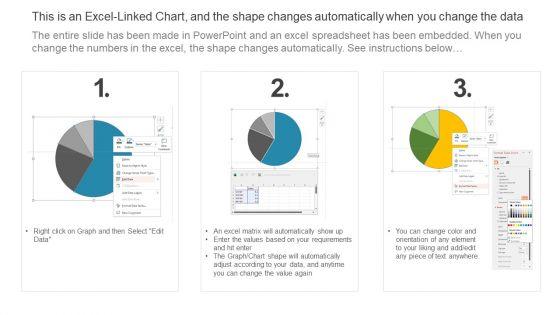
Improve your presentation delivery using this Website Data Ppt PowerPoint Presentation Complete With Slides. Support your business vision and objectives using this well-structured PPT deck. This template offers a great starting point for delivering beautifully designed presentations on the topic of your choice. Comprising sixteen this professionally designed template is all you need to host discussion and meetings with collaborators. Each slide is self-explanatory and equipped with high-quality graphics that can be adjusted to your needs. Therefore, you will face no difficulty in portraying your desired content using this PPT slideshow. This PowerPoint slideshow contains every important element that you need for a great pitch. It is not only editable but also available for immediate download and utilization. The color, font size, background, shapes everything can be modified to create your unique presentation layout. Therefore, download it now.


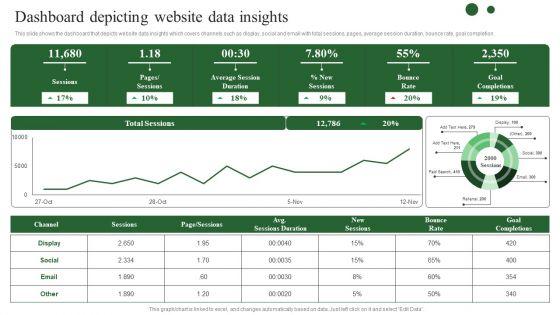
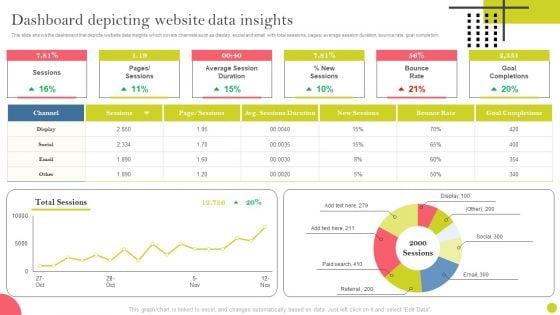
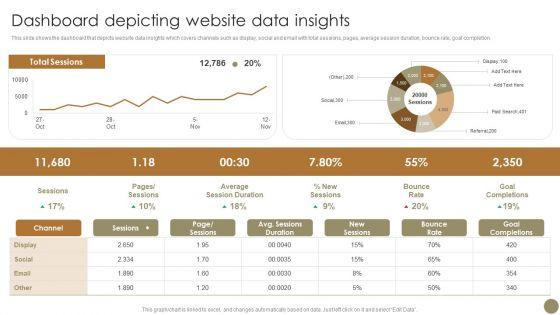
This slide shows the dashboard that depicts website data insights which covers channels such as display, social and email with total sessions, pages, average session duration, bounce rate, goal completion. Are you in need of a template that can accommodate all of your creative concepts This one is crafted professionally and can be altered to fit any style. Use it with Google Slides or PowerPoint. Include striking photographs, symbols, depictions, and other visuals. Fill, move around, or remove text boxes as desired. Test out color palettes and font mixtures. Edit and save your work, or work with colleagues. Download Brand Development Techniques To Increase Revenues Dashboard Depicting Website Data Diagrams PDF and observe how to make your presentation outstanding. Give an impeccable presentation to your group and make your presentation unforgettable.

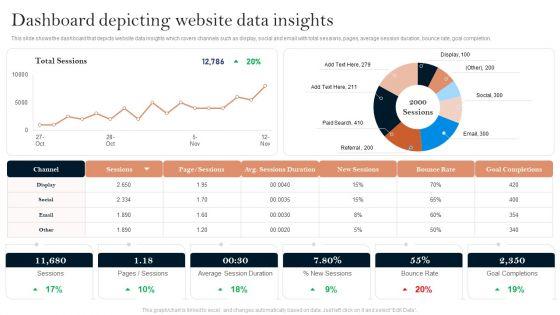
This slide shows the dashboard that depicts website data insights which covers channels such as display, social and email with total sessions, pages, average session duration, bounce rate, goal completion. There are so many reasons you need a Identifying And Increasing Brand Awareness Dashboard Depicting Website Data Insights Rules PDF. The first reason is you can not spend time making everything from scratch, Thus, Slidegeeks has made presentation templates for you too. You can easily download these templates from our website easily.
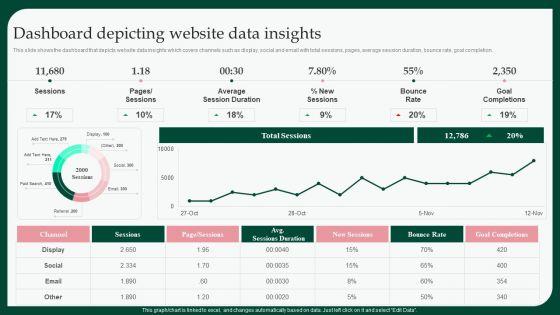

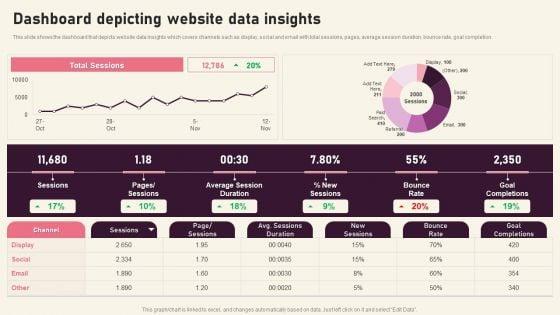
This slide shows the dashboard that depicts website data insights which covers channels such as display, social and email with total sessions, pages, average session duration, bounce rate, goal completion. Coming up with a presentation necessitates that the majority of the effort goes into the content and the message you intend to convey. The visuals of a PowerPoint presentation can only be effective if it supplements and supports the story that is being told. Keeping this in mind our experts created Boosting Product Sales Through Branding Dashboard Depicting Website Data Brochure PDF to reduce the time that goes into designing the presentation. This way, you can concentrate on the message while our designers take care of providing you with the right template for the situation.
This slide shows the dashboard that depicts website data insights which covers channels such as display, social and email with total sessions, pages, average session duration, bounce rate, goal completion. Get a simple yet stunning designed Implementing Brand Development Dashboard Depicting Website Data Insights Guidelines PDF. It is the best one to establish the tone in your meetings. It is an excellent way to make your presentations highly effective. So, download this PPT today from Slidegeeks and see the positive impacts. Our easy-to-edit Implementing Brand Development Dashboard Depicting Website Data Insights Guidelines PDF can be your go-to option for all upcoming conferences and meetings. So, what are you waiting for Grab this template today.

This slide shows the dashboard that depicts website data insights which covers channels such as display, social and email with total sessions, pages, average session duration, bounce rate, goal completion. Coming up with a presentation necessitates that the majority of the effort goes into the content and the message you intend to convey. The visuals of a PowerPoint presentation can only be effective if it supplements and supports the story that is being told. Keeping this in mind our experts created Echniques To Enhance Brand Dashboard Depicting Website Data Insights Clipart PDF to reduce the time that goes into designing the presentation. This way, you can concentrate on the message while our designers take care of providing you with the right template for the situation.

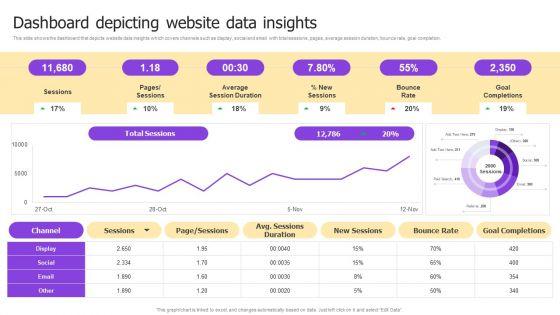
Do you have to make sure that everyone on your team knows about any specific topic. I yes, then you should give Successful Branding Technique For Electronic Commerce Corporation Dashboard Depicting Website Data Insights Microsoft PDF a try. Our experts have put a lot of knowledge and effort into creating this impeccable Successful Branding Technique For Electronic Commerce Corporation Dashboard Depicting Website Data Insights Microsoft PDF. You can use this template for your upcoming presentations, as the slides are perfect to represent even the tiniest detail. You can download these templates from the Slidegeeks website and these are easy to edit. So grab these today.

This slide shows the dashboard that depicts website data insights which covers channels such as display, social and email with total sessions, pages, average session duration, bounce rate, goal completion.Do you have to make sure that everyone on your team knows about any specific topic I yes, then you should give Dashboard Depicting Website Data Insights Creating Branding Techniques To Increase Brand Awareness Structure PDF a try. Our experts have put a lot of knowledge and effort into creating this impeccable Dashboard Depicting Website Data Insights Creating Branding Techniques To Increase Brand Awareness Structure PDF. You can use this template for your upcoming presentations, as the slides are perfect to represent even the tiniest detail. You can download these templates from the Slidegeeks website and these are easy to edit. So grab these today.

The following slide highlights the companys audience demographics distribution based on people age and gender to make business strategy for target market. Deliver an awe inspiring pitch with this creative Pureprofile Business Overview Website Visitors Data Ppt Show Design Templates PDF bundle. Topics like Gender Distribution, Age Distribution, Key Insights can be discussed with this completely editable template. It is available for immediate download depending on the needs and requirements of the user.
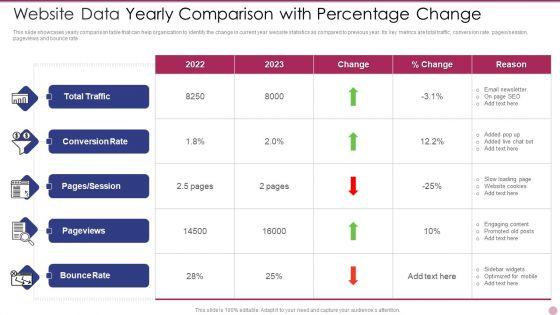

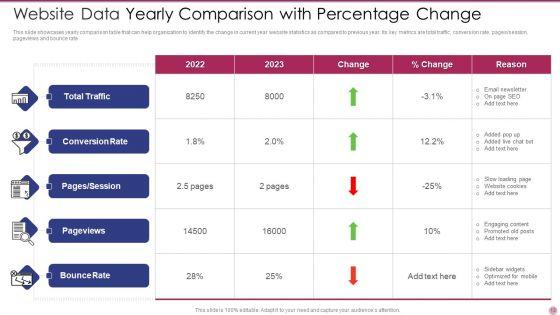
This slide showcases yearly comparison table that can help organization to identify the change in current year website statistics as compared to previous year. Its key metrics are total traffic, conversion rate, pages or session, pageviews and bounce rate. Pitch your topic with ease and precision using this Website Data Yearly Comparison With Percentage Change Formats PDF. This layout presents information on Website Data Yearly Comparison With Percentage Change. It is also available for immediate download and adjustment. So, changes can be made in the color, design, graphics or any other component to create a unique layout.


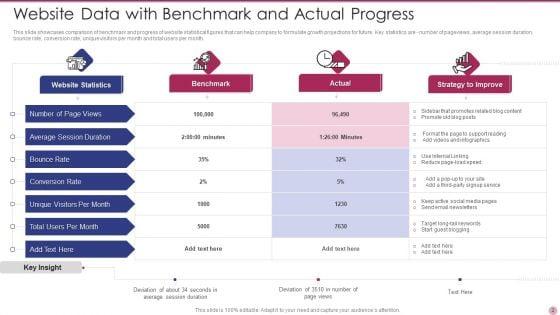
This slide showcases comparison of benchmark and progress of website statistical figures that can help company to formulate growth projections for future. Key statistics are - number of pageviews, average session duration, bounce rate, conversion rate, unique visitors per month and total users per month. Showcasing this set of slides titled Website Data With Benchmark And Actual Progress Clipart PDF. The topics addressed in these templates are Conversion Rate, Bounce Rate, Average. All the content presented in this PPT design is completely editable. Download it and make adjustments in color, background, font etc. as per your unique business setting.
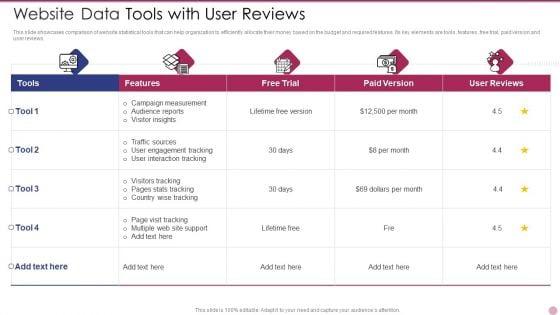
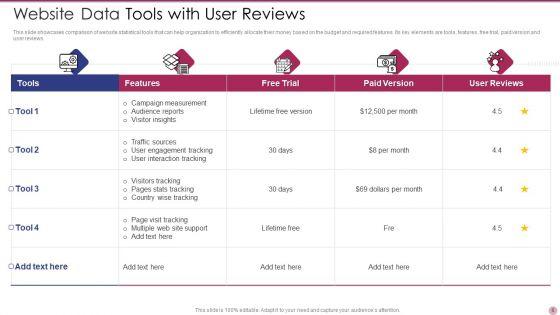
This slide showcases comparison of website statistical tools that can help organization to efficiently allocate their money based on the budget and required features. Its key elements are tools, features, free trial, paid version and user reviews. Pitch your topic with ease and precision using this Website Data Tools With User Reviews Microsoft PDF. This layout presents information on Website Data Tools With User Reviews. It is also available for immediate download and adjustment. So, changes can be made in the color, design, graphics or any other component to create a unique layout.
Persuade your audience using this Website Data Report Icon With Monthly Traffic Performance Brochure PDF. This PPT design covers four stages, thus making it a great tool to use. It also caters to a variety of topics including Website Data Report Icon With Monthly Traffic Performance. Download this PPT design now to present a convincing pitch that not only emphasizes the topic but also showcases your presentation skills.

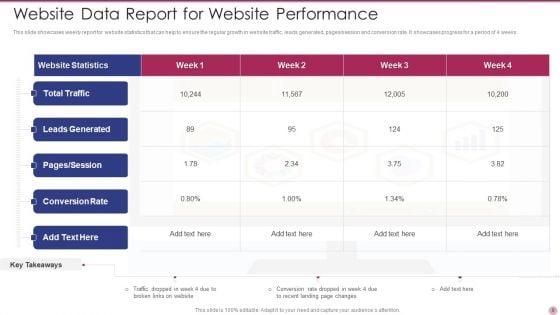
This slide showcases weekly report for website statistics that can help to ensure the regular growth in website traffic, leads generated, pages or session and conversion rate. It showcases progress for a period of 4 weeks. Pitch your topic with ease and precision using this Website Data Report For Website Performance Background PDF. This layout presents information on Website Data Report For Website Performance. It is also available for immediate download and adjustment. So, changes can be made in the color, design, graphics or any other component to create a unique layout.
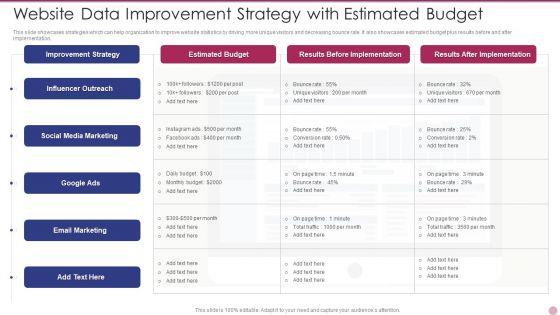

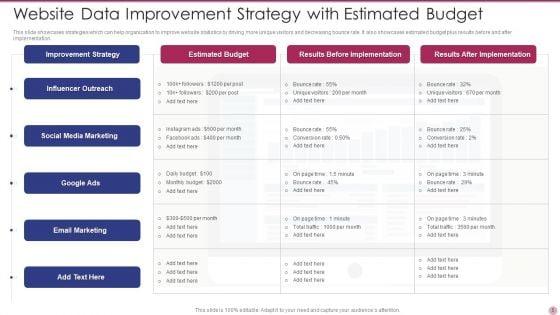
This slide showcases strategies which can help organization to improve website statistics by driving more unique visitors and decreasing bounce rate. It also showcases estimated budget plus results before and after implementation. Showcasing this set of slides titled Website Data Improvement Strategy With Estimated Budget Formats PDF. The topics addressed in these templates are Social Media Marketing, Improvement Strategy, Email Marketing . All the content presented in this PPT design is completely editable. Download it and make adjustments in color, background, font etc. as per your unique business setting.
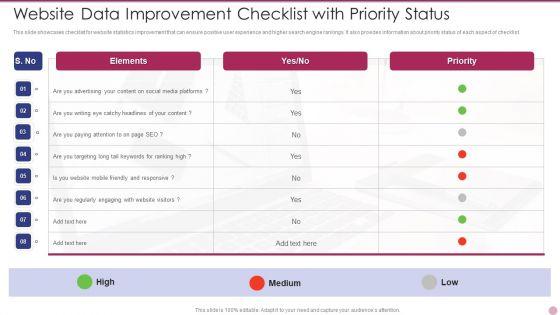

This slide showcases checklist for website statistics improvement that can ensure positive user experience and higher search engine rankings. It also provides information about priority status of each aspect of checklist. Pitch your topic with ease and precision using this Website Data Improvement Checklist With Priority Status Formats PDF. This layout presents information on Website Data Improvement Checklist With Priority Status. It is also available for immediate download and adjustment. So, changes can be made in the color, design, graphics or any other component to create a unique layout.

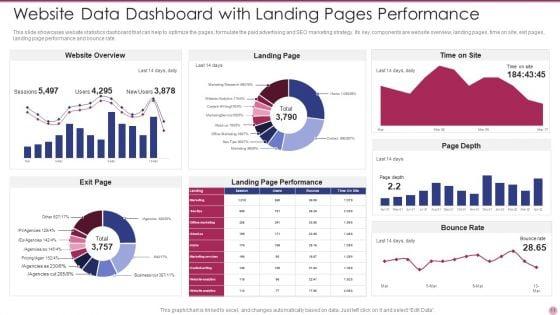
This slide showcases website statistics dashboard that can help to optimize the pages, formulate the paid advertising and SEO marketing strategy. Its key components are website overview, landing pages, time on site, exit pages, landing page performance and bounce rate. Showcasing this set of slides titled Website Data Dashboard With Landing Pages Performance Formats PDF. The topics addressed in these templates are Website Data Dashboard With Landing Pages Performance. All the content presented in this PPT design is completely editable. Download it and make adjustments in color, background, font etc. as per your unique business setting.
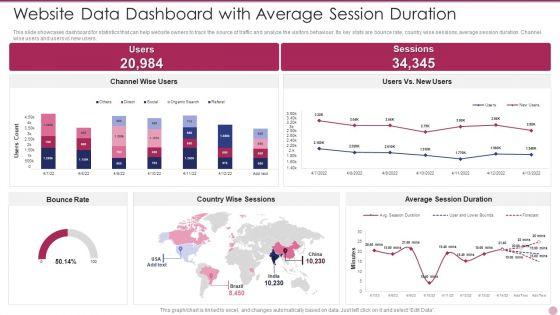

This slide showcases dashboard for statistics that can help website owners to track the source of traffic and analyze the visitors behaviour. Its key stats are bounce rate, country wise sessions, average session duration. Channel wise users and users vs new users. Pitch your topic with ease and precision using this Website Data Dashboard With Average Session Duration Ideas PDF. This layout presents information on Website Data Dashboard With Average Session Duration. It is also available for immediate download and adjustment. So, changes can be made in the color, design, graphics or any other component to create a unique layout.
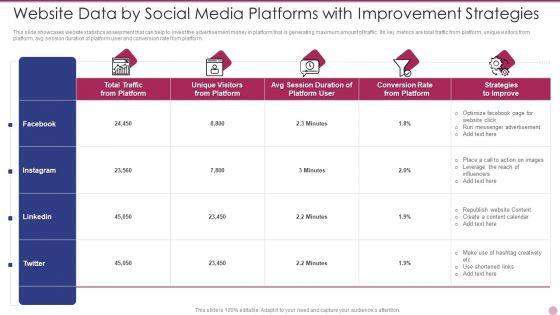

This slide showcases website statistics assessment that can help to invest the advertisement money in platform that is generating maximum amount of traffic. Its key metrics are total traffic from platform, unique visitors from platform, avg session duration of platform user and conversion rate from platform. Showcasing this set of slides titled Website Data By Social Media Platforms With Improvement Strategies Diagrams PDF. The topics addressed in these templates are Strategies To Improve, Advertisement, Optimize. All the content presented in this PPT design is completely editable. Download it and make adjustments in color, background, font etc. as per your unique business setting.
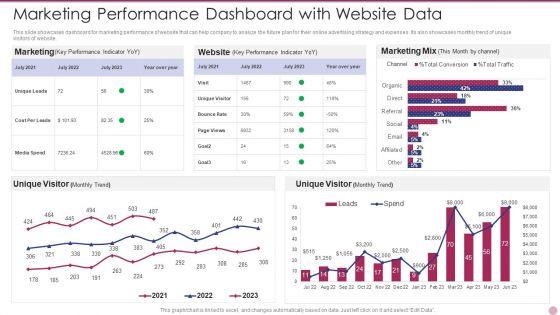

This slide showcases dashboard for marketing performance of website that can help company to analyze the future plan for their online advertising strategy and expenses. Its also showcases monthly trend of unique visitors of website. Pitch your topic with ease and precision using this Marketing Performance Dashboard With Website Data Elements PDF. This layout presents information on Marketing Performance Dashboard With Website Data. It is also available for immediate download and adjustment. So, changes can be made in the color, design, graphics or any other component to create a unique layout.
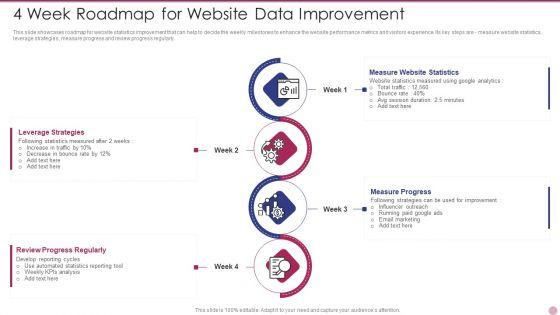

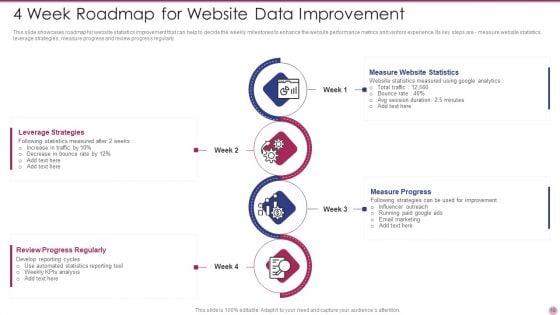
This slide showcases roadmap for website statistics improvement that can help to decide the weekly milestones to enhance the website performance metrics and visitors experience. Its key steps are measure website statistics, leverage strategies, measure progress and review progress regularly. Presenting 4 Week Roadmap For Website Data Improvement Pictures PDF to dispense important information. This template comprises four stages. It also presents valuable insights into the topics including Measure Website Statistics, Measure Progress, Leverage Strategies. This is a completely customizable PowerPoint theme that can be put to use immediately. So, download it and address the topic impactfully.


Pitch your topic with ease and precision using this website data protection report with status ppt powerpoint presentation file example topics pdf. This layout presents information on website, data breaches, malware. It is also available for immediate download and adjustment. So, changes can be made in the color, design, graphics or any other component to create a unique layout.
Presenting this set of slides with name work breakdown structure website database development ppt powerpoint presentation pictures templates cpb pdf. This is an editable Powerpoint four stages graphic that deals with topics like work breakdown structure website database development to help convey your message better graphically. This product is a premium product available for immediate download and is 100 percent editable in Powerpoint. Download this now and use it in your presentations to impress your audience.


Persuade your audience using this Shopping Website Big Data Analytics Icon Ideas PDF. This PPT design covers three stages, thus making it a great tool to use. It also caters to a variety of topics including Shopping Website, Big Data Analytics Icon. Download this PPT design now to present a convincing pitch that not only emphasizes the topic but also showcases your presentation skills.
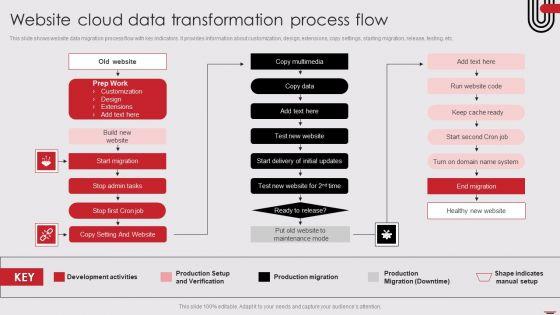
This slide shows website data migration process flow with key indicators. It provides information about customization, design, extensions, copy settings, starting migration, release, testing, etc. Showcasing this set of slides titled Website Cloud Data Transformation Process Flow Elements PDF. The topics addressed in these templates are Prep Work, Start Migration, Stop Admin Tasks. All the content presented in this PPT design is completely editable. Download it and make adjustments in color, background, font etc. as per your unique business setting.
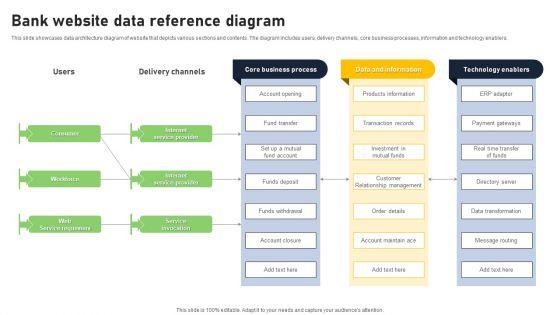
This slide showcases data architecture diagram of website that depicts various sections and contents. The diagram includes users, delivery channels, core business processes, information and technology enablers. Showcasing this set of slides titled Bank Website Data Reference Diagram Mockup PDF. The topics addressed in these templates are Core Business Process, Data Information, Technology Enablers. All the content presented in this PPT design is completely editable. Download it and make adjustments in color, background, font etc. as per your unique business setting.
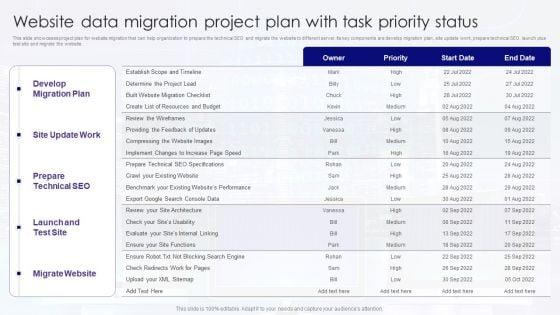
This slide showcases project plan for website migration that can help organization to prepare the technical SEO and migrate the website to different server. Its key components are develop migration plan, site update work, prepare technical SEO, launch plus test site and migrate the website. Showcasing this set of slides titled Website Data Migration Project Plan With Task Priority Status Portrait PDF. The topics addressed in these templates are Develop Migration Plan, Determine, Implement Changes. All the content presented in this PPT design is completely editable. Download it and make adjustments in color, background, font etc. as per your unique business setting.


This slide illustrates a KPI dashboard highlighting application of prescriptive analytics to analyze website visits and sales. It covers KPIs such as monthly visitors, monthly sales, cash deposits, increase in subscribers and orders received.This modern and well-arranged Prescriptive Analytics Dashboard To Track Website Sales Data Analytics SS V provides lots of creative possibilities. It is very simple to customize and edit with the Powerpoint Software. Just drag and drop your pictures into the shapes. All facets of this template can be edited with Powerpoint, no extra software is necessary. Add your own material, put your images in the places assigned for them, adjust the colors, and then you can show your slides to the world, with an animated slide included. This slide illustrates a KPI dashboard highlighting application of prescriptive analytics to analyze website visits and sales. It covers KPIs such as monthly visitors, monthly sales, cash deposits, increase in subscribers and orders received.
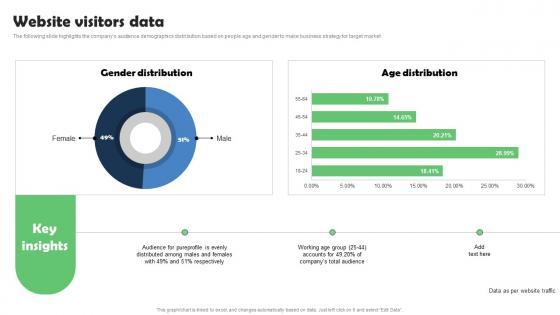

The following slide highlights the companys audience demographics distribution based on people age and gender to make business strategy for target market. Want to ace your presentation in front of a live audience Our Website Visitors Data Marketing Research Services Management Business Download Pdf can help you do that by engaging all the users towards you. Slidegeeks experts have put their efforts and expertise into creating these impeccable powerpoint presentations so that you can communicate your ideas clearly. Moreover, all the templates are customizable, and easy-to-edit and downloadable. Use these for both personal and commercial use. The following slide highlights the companys audience demographics distribution based on people age and gender to make business strategy for target market.
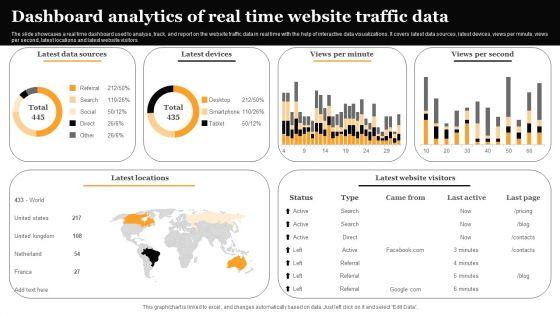

The slide showcases a real time dashboard used to analyse, track, and report on the website traffic data in real time with the help of interactive data visualizations. It covers latest data sources, latest devices, views per minute, views per second, latest locations and latest website visitors. Showcasing this set of slides titled Dashboard Analytics Of Real Time Website Traffic Data Information PDF. The topics addressed in these templates are Latest Data Sources, Latest Devices, Views Per Second. All the content presented in this PPT design is completely editable. Download it and make adjustments in color, background, font etc. as per your unique business setting.
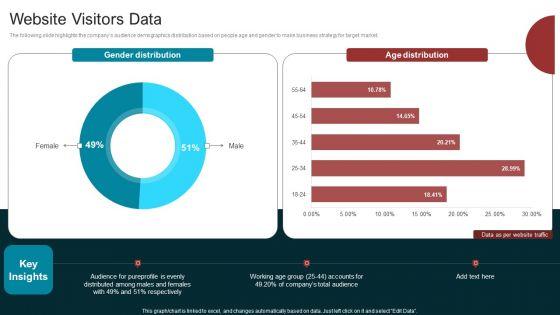

The following slide highlights the companys audience demographics distribution based on people age and gender to make business strategy for target market. Get a simple yet stunning designed Marketing Agency Company Outline Website Visitors Data Background PDF. It is the best one to establish the tone in your meetings. It is an excellent way to make your presentations highly effective. So, download this PPT today from Slidegeeks and see the positive impacts. Our easy to edit Marketing Agency Company Outline Website Visitors Data Background PDF can be your go to option for all upcoming conferences and meetings. So, what are you waiting for Grab this template today.
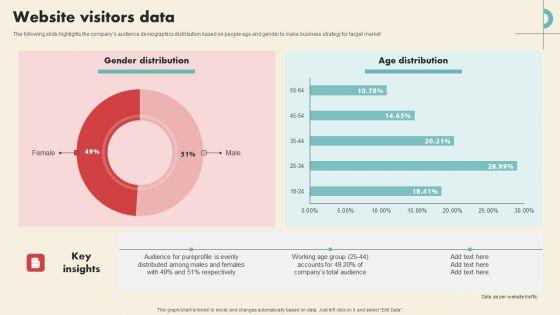
The following slide highlights the companys audience demographics distribution based on people age and gender to make business strategy for target market Slidegeeks is one of the best resources for PowerPoint templates. You can download easily and regulate Data Driven Marketing Solutions Firm Company Profile Website Visitors Data Guidelines PDF for your personal presentations from our wonderful collection. A few clicks is all it takes to discover and get the most relevant and appropriate templates. Use our Templates to add a unique zing and appeal to your presentation and meetings. All the slides are easy to edit and you can use them even for advertisement purposes.
33 Item(s)