 AI PPT Maker
 Templates
 PPT Bundles
 Design Services
 Business PPTs
 Business Plan
 Management
 Strategy
 Introduction PPT
 Roadmap
 Self Introduction
 Timelines
 Process
 Marketing
 Agenda
 Technology
 Medical
 Startup Business Plan
 Cyber Security
 Dashboards
 SWOT
SWOT Proposals
 Education
 Pitch Deck
 Digital Marketing
 KPIs
KPIs Project Management
 Product Management
 Artificial Intelligence
 Target Market
 Communication
 Supply Chain
 Google Slides
 Research Services
 One Pagers
 All Categories
Revenue Operations PowerPoint Presentation Templates and Google Slides
55 Item(s)
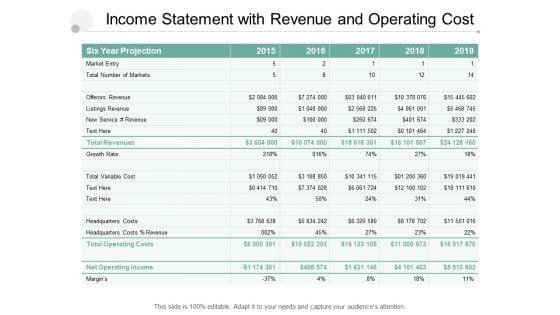
Presenting this set of slides with name income statement with revenue and operating cost ppt powerpoint presentation inspiration guidelines. The topics discussed in these slides are financial analysis, balance sheet, income statement. This is a completely editable PowerPoint presentation and is available for immediate download. Download now and impress your audience.
The best PPT templates are a great way to save time, energy, and resources. Slidegeeks have 100 percent editable powerpoint slides making them incredibly versatile. With these quality presentation templates, you can create a captivating and memorable presentation by combining visually appealing slides and effectively communicating your message. Download Self Care Products Company Outline Revenue Operating Profit And PAT Background PDF from Slidegeeks and deliver a wonderful presentation.


This slide highlights the Nielsen company revenue and operating income for the last 3 years. It includes the data in million of US dollars with a key takeaways section. Slidegeeks is here to make your presentations a breeze with Market Study Company Outline Revenue And Operating Income Themes PDF With our easy to use and customizable templates, you can focus on delivering your ideas rather than worrying about formatting. With a variety of designs to choose from, you are sure to find one that suits your needs. And with animations and unique photos, illustrations, and fonts, you can make your presentation pop. So whether you are giving a sales pitch or presenting to the board, make sure to check out Slidegeeks first.
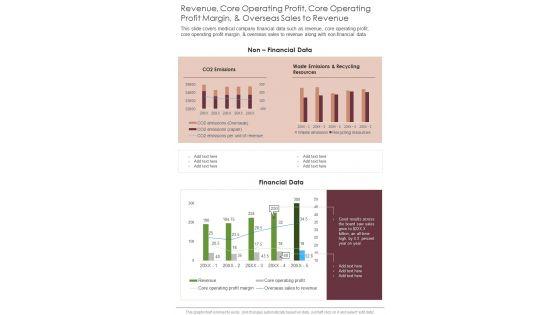
Presenting you an exemplary Revenue Core Operating Profit Core Operating Profit Margin And Overseas Sales To Revenue One Pager Documents. Our one-pager comprises all the must-have essentials of an inclusive document. You can edit it with ease, as its layout is completely editable. With such freedom, you can tweak its design and other elements to your requirements. Download this Revenue Core Operating Profit Core Operating Profit Margin And Overseas Sales To Revenue One Pager Documents brilliant piece now.


This slide shows the details of the revenues and operating expenses of the company hat has occurred and that will be occurred in the future. It also includes the comparison of historical as well as forecasted data for 5 years.Showcasing this set of slides titled Revenue And Operation Expenses Comparison Chart Slides PDF. The topics addressed in these templates are Continuous Increase, Operating Cost, Enhancement Ultimately. All the content presented in this PPT design is completely editable. Download it and make adjustments in color, background, font etc. as per your unique business setting.


This slide highlights the Nielsen company revenue and operating income for the last 3 years. It includes the data in million of US dollars with a key takeaways section. This Nielsen Business Profile Revenue And Operating Income Ppt PowerPoint Presentation Diagram PDF from Slidegeeks makes it easy to present information on your topic with precision. It provides customization options, so you can make changes to the colors, design, graphics, or any other component to create a unique layout. It is also available for immediate download, so you can begin using it right away. Slidegeeks has done good research to ensure that you have everything you need to make your presentation stand out. Make a name out there for a brilliant performance.


This slide illustrates performance analysis using operating revenue, operating expenditure opex and income metrics which can be referred by organizations to evaluate their inflows and outflows to make relevant decisions for increasing profitability. It includes information about operating revenue, operating expense and income before taxes. Pitch your topic with ease and precision using this Performance Analysis Using Operating Revenue Business Operational Expenditure And Income Metrics Diagrams PDF. This layout presents information on Taxes, Highest Operating, Recorded. It is also available for immediate download and adjustment. So, changes can be made in the color, design, graphics or any other component to create a unique layout.
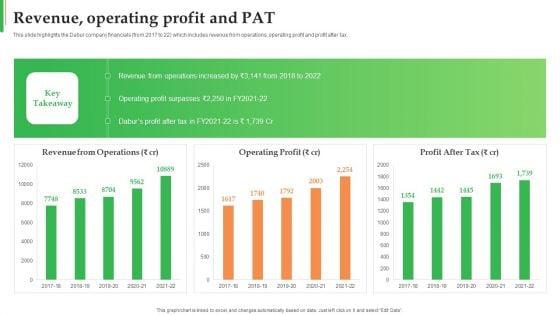

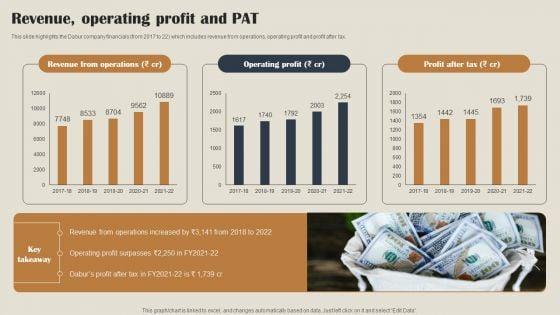
This slide highlights the Dabur company financials from 2017 to 22 which includes revenue from operations, operating profit and profit after tax. Deliver an awe inspiring pitch with this creative Dabur Business Profile Revenue Operating Profit And Pat Ppt Model Background Images PDF bundle. Topics like Revenue Operations, Operating Profit, Profit After Tax can be discussed with this completely editable template. It is available for immediate download depending on the needs and requirements of the user.


Deliver an awe inspiring pitch with this creative Affle India Ltd Business Profile Revenue From Operations From 2018 To 2022 Microsoft PDF bundle. Topics like Consumer Platform, Enterprise Platform, Revenue can be discussed with this completely editable template. It is available for immediate download depending on the needs and requirements of the user.

This slide showcases chart that can help organization compare and analyze the operating profits generated by organization in different financial years. It also showcases yearly comparison of net income, revenue and operating profit margin. Pitch your topic with ease and precision using this Yearly Net Income Statement Graph With Revenue And Operating Profit Margin Download PDF. This layout presents information on Revenue, Net Income, Operating Profit Margin. It is also available for immediate download and adjustment. So, changes can be made in the color, design, graphics or any other component to create a unique layout.


The slide provides revenue and operating expenses comparison for last three years 2017 to 2019 and coming five years 2020 to 2024.Deliver and pitch your topic in the best possible manner with this Investment Banking Security Underwriting Pitchbook Financials Forecast Revenue Vs Operating Expenses Sample PDF Use them to share invaluable insights on Operating Expenses, Operating Expenses, Revenue and impress your audience. This template can be altered and modified as per your expectations. So, grab it now.


The slide provides revenue and operating expenses comparison for last three years 2019 to 2021 and coming five years 2022 to 2026. Deliver an awe inspiring pitch with this creative pitch book capital funding deal ipo pitchbook financials forecast revenue vs operating expenses rules pdf bundle. Topics like revenue vs operating expenses, 2019 to 2020, revenue, operating expenses can be discussed with this completely editable template. It is available for immediate download depending on the needs and requirements of the user.


The slide provides the comparison of revenue and operating expenses for the year 2016 to 2021 historical and 2022 to 2025 forecasted. Deliver an awe inspiring pitch with this creative fundraising from corporate investment revenue and operating expenses comparison historical pictures pdf bundle. Topics like net revenue, operating cost can be discussed with this completely editable template. It is available for immediate download depending on the needs and requirements of the user.


This slide shows the Shareholder value such as revenue growth, operating margin, capital efficiency and their sub categories. This is a procedure to identify the shareholder value shareholder value for revenue growth operating margin background pdf template with various stages. Focus and dispense information on three stages using this creative set, that comes with editable features. It contains large content boxes to add your information on topics like revenue growth, operating margin, capital efficiency. You can also showcase facts, figures, and other relevant content using this PPT layout. Grab it now.


Pitch Book For Investor Funding Contract Financials Forecast Revenue Vs Operating Expenses Ideas PDF
The slide provides revenue and operating expenses comparison for last three years 2017 to 2019 and coming five years 2020 to 2024. Deliver and pitch your topic in the best possible manner with this pitch book for investor funding contract financials forecast revenue vs operating expenses ideas pdf. Use them to share invaluable insights on revenue, operating expenses and impress your audience. This template can be altered and modified as per your expectations. So, grab it now.


The slide provides revenue and operating expenses comparison for last three years 2019-2021 and coming five years 2022-2026. Deliver and pitch your topic in the best possible manner with this financing catalogue for security underwriting agreement financials forecast revenue vs operating demonstration pdf. Use them to share invaluable insights on revenue, operating expenses and impress your audience. This template can be altered and modified as per your expectations. So, grab it now.


This slide shows the Shareholder value such as revenue growth, operating margin, capital efficiency and their sub categories.This is a shareholder value for revenue growth operating margin inspiration pdf template with various stages. Focus and dispense information on three stages using this creative set, that comes with editable features. It contains large content boxes to add your information on topics like revenue growth, operating margin, capital efficiency. You can also showcase facts, figures, and other relevant content using this PPT layout. Grab it now.


This slide shows the Shareholder value such as revenue growth, operating margin, capital efficiency and their sub categories. This is a stockholder value for revenue growth operating margin ppt infographic template grid pdf template with various stages. Focus and dispense information on three stages using this creative set, that comes with editable features. It contains large content boxes to add your information on topics like revenue growth, operating margin, capital efficiency. You can also showcase facts, figures, and other relevant content using this PPT layout. Grab it now.


This slide shows the Shareholder value such as revenue growth, operating margin, capital efficiency and their sub categories. This is a shareholder value for revenue growth operating margin stakeholder capitalism for long term value addition introduction pdf template with various stages. Focus and dispense information on three stages using this creative set, that comes with editable features. It contains large content boxes to add your information on topics like revenue growth, operating margin, capital efficiency. You can also showcase facts, figures, and other relevant content using this PPT layout. Grab it now.


The slide shows the graph of companys revenue and operating income for five years 2016 to 2020. It also provides key facts such as, CAGR growth rate and key reasons behind the decline or growth of companys revenue. Deliver and pitch your topic in the best possible manner with this key financials revenue and operating income ppt ideas show pdf. Use them to share invaluable insights on revenue, operating income and impress your audience. This template can be altered and modified as per your expectations. So, grab it now.


The slide shows the graph of companys forecasted revenue and operating income 2020 to 2024 post implementing the strategy. It also provides CAGR growth rate and other key facts. Deliver and pitch your topic in the best possible manner with this financials after strategy implementation revenue and operating income elements pdf. Use them to share invaluable insights on revenue, operating income and impress your audience. This template can be altered and modified as per your expectations. So, grab it now.


This slide shows the Shareholder value such as revenue growth, operating margin, capital efficiency and their sub categories. Deliver and pitch your topic in the best possible manner with this shareholder value for revenue growth operating margin techniques increase stakeholder value ideas pdf. Use them to share invaluable insights on revenue growth, operating margin, capital efficiency and impress your audience. This template can be altered and modified as per your expectations. So, grab it now.


The slide provides revenue and operating expenses comparison for last three years 2019 2021 and coming five years 2022 2026. Deliver and pitch your topic in the best possible manner with this pitchbook for ipo deal financials forecast revenue vs operating expenses download pdf. Use them to share invaluable insights on revenue, operating expenses and impress your audience. This template can be altered and modified as per your expectations. So, grab it now.


The slide provides revenue and operating expenses comparison for last three years 2019 to 2021 and coming five years 2022 to 2026. Deliver and pitch your topic in the best possible manner with this financials forecast revenue vs operating expenses deal pitchbook ipo demonstration pdf. Use them to share invaluable insights on revenue, operating expenses and impress your audience. This template can be altered and modified as per your expectations. So, grab it now.


The slide shows the business revenue model of the firm which displays the cost incurred and the various sources of income. This is a business revenue model operating manual ppt professional inspiration pdf template with various stages. Focus and dispense information on five stages using this creative set, that comes with editable features. It contains large content boxes to add your information on topics like services, value, resources, cost structure, material, revenue streams. You can also showcase facts, figures, and other relevant content using this PPT layout. Grab it now.


The slide provides the graph of forecasted revenue and total cost of the company in next five years. It also shows the breakeven point. Deliver and pitch your topic in the best possible manner with this seed funding pitch deck revenue vs operational expenses projections designs pdf. Use them to share invaluable insights on gross revenue, total cost and impress your audience. This template can be altered and modified as per your expectations. So, grab it now.


The slide provides the comparison of revenue and operating expenses for the year 2015 - 2020 historical and 2021 - 2024 forecasted. Deliver an awe inspiring pitch with this creative revenue and operating expenses comparison historical vs forecasted summary pdf bundle. Topics like net revenue, operating cost, operating expenses can be discussed with this completely editable template. It is available for immediate download depending on the needs and requirements of the user.


The slide shows the graph of companys revenue and operating income for five years 2016 to 2020. It also provides key facts such as, CAGR growth rate and key reasons behind the decline or growth of companys revenue. Deliver and pitch your topic in the best possible manner with this key financials revenue and operating income topics pdf. Use them to share invaluable insights on revenue, operating income, key notes and impress your audience. This template can be altered and modified as per your expectations. So, grab it now.


The slide shows the graph of companys forecasted revenue and operating income 2020 to 2024 post implementing the strategy. It also provides CAGR growth rate and other key facts. Deliver an awe-inspiring pitch with this creative financials after strategy implementation revenue and operating income topics pdf bundle. Topics like financials after strategy implementation revenue and operating income can be discussed with this completely editable template. It is available for immediate download depending on the needs and requirements of the user.


The slide provides the comparison of revenue and operating expenses for the year 2015 2020 historical and 2021 2024 forecasted. Deliver an awe-inspiring pitch with this creative revenue and operating expenses comparison historical vs forecasted pictures pdf. bundle. Topics like revenue and operating expenses comparison historical vs forecasted can be discussed with this completely editable template. It is available for immediate download depending on the needs and requirements of the user.


The slide provides the comparison of revenue and operating expenses for the year 2015 2020 historical and 2021 2024 forecasted. Deliver an awe-inspiring pitch with this creative revenue and operating expenses comparison historical vs forecasted background pdf. bundle. Topics like revenue and operating expenses comparison historical vs forecasted can be discussed with this completely editable template. It is available for immediate download depending on the needs and requirements of the user.


The slide provides the comparison of revenue and operating expenses for the year 2015 2020 historical and 2021 2024 forecasted. Deliver an awe inspiring pitch with this creative revenue and operating expenses comparison historical vs forecasted ppt summary clipart pdf bundle. Topics like revenue and operating expenses comparison historical vs forecasted can be discussed with this completely editable template. It is available for immediate download depending on the needs and requirements of the user.


The slide shows the graph of companys forecasted revenue and operating income 2020 to 2024 post implementing the strategy. It also provides CAGR growth rate and other key facts.Deliver and pitch your topic in the best possible manner with this financials after strategy implementation revenue and operating income mockup pdf. Use them to share invaluable insights on revenue, operating income, 2020 to 2024 and impress your audience. This template can be altered and modified as per your expectations. So, grab it now.


The slide shows the graph of companys revenue and operating income for five years 2017 to 2021. It also provides key facts such as, CAGR growth rate and key reasons behind the decline or growth of companys revenue. Deliver an awe inspiring pitch with this creative key financials revenue and operating income graphics pdf bundle. Topics like key financials revenue and operating income can be discussed with this completely editable template. It is available for immediate download depending on the needs and requirements of the user.


The slide shows the graph of companys forecasted revenue and operating income 2020 to 2024 post implementing the strategy. It also provides CAGR growth rate and other key facts. Deliver and pitch your topic in the best possible manner with this financials after strategy implementation revenue and operating income themes pdf. Use them to share invaluable insights on financials after strategy implementation revenue and operating income and impress your audience. This template can be altered and modified as per your expectations. So, grab it now.


The slide provides the graph of forecasted revenue and total cost of the company in next five years. It also shows the breakeven point. Deliver an awe inspiring pitch with this creative investor pitch deck to generate capital from pre seed round revenue vs operational expenses projections infographics pdf bundle. Topics like revenue vs operational expenses projections can be discussed with this completely editable template. It is available for immediate download depending on the needs and requirements of the user.


The slide provides the graph of forecasted revenue and total cost of the company in next five years. It also shows the breakeven point. Deliver an awe inspiring pitch with this creative angel investor for seed pitch deck revenue vs operational expenses projections microsoft pdf bundle. Topics like revenue vs operational expenses projections can be discussed with this completely editable template. It is available for immediate download depending on the needs and requirements of the user.
The slide provides the graph of forecasted revenue and total cost of the company in next five years. It also shows the breakeven point. Deliver and pitch your topic in the best possible manner with this pre seed funding pitch deck revenue vs operational expenses projections ppt icon pictures pdf. Use them to share invaluable insights on revenue vs operational expenses projections and impress your audience. This template can be altered and modified as per your expectations. So, grab it now.


Pitch your topic with ease and precision using this eight column chart for business revenue and operating income ppt powerpoint presentation gallery structure pdf. This layout presents information on revenue, operating income, net income. It is also available for immediate download and adjustment. So, changes can be made in the colour, design, graphics or any other component to create a unique layout.


The slide provides the graph of forecasted revenue and total cost of the company in next five years. It also shows the breakeven point. Deliver and pitch your topic in the best possible manner with this pitch deck to gather funding from initial capital revenue vs operational expenses projections introduction pdf. Use them to share invaluable insights on revenue vs operational expenses projections and impress your audience. This template can be altered and modified as per your expectations. So, grab it now.


The slide provides the graph of forecasted revenue and total cost of the company in next five years. It also shows the breakeven point. Deliver and pitch your topic in the best possible manner with this pitch deck to collect funding from initial financing revenue vs operational expenses projections formats pdf. Use them to share invaluable insights on revenue vs operational expenses projections and impress your audience. This template can be altered and modified as per your expectations. So, grab it now.


The slide provides the graph of forecasted revenue and total cost of the company in next five years. It also shows the breakeven point. Deliver and pitch your topic in the best possible manner with this pitch deck for seed financing revenue vs operational expenses projections ppt show outline pdf. Use them to share invaluable insights on revenue vs operational expenses projections and impress your audience. This template can be altered and modified as per your expectations. So, grab it now.


Showcasing this set of slides titled raise funding from pre seed money revenue vs operational expenses projections inspiration pdf. The topics addressed in these templates are revenue vs operational expenses projections. All the content presented in this PPT design is completely editable. Download it and make adjustments in color, background, font etc. as per your unique business setting.


The slide provides the graph of forecasted revenue and total cost of the company in next five years. It also shows the breakeven point. Pitch your topic with ease and precision using this raise funding from pre seed capital revenue vs operational expenses projections background pdf. This layout presents information on revenue vs operational expenses projections. It is also available for immediate download and adjustment. So, changes can be made in the color, design, graphics or any other component to create a unique layout.


Presenting this set of slides with name abc methodology with sales revenue and operating income ppt powerpoint presentation file information pdf. The topics discussed in these slides are sales revenues, material cost, operating income, return on sales, product. This is a completely editable PowerPoint presentation and is available for immediate download. Download now and impress your audience.


This slide highlights the projected company growth rate which highlights the revenue, operating income, acquisition related expenses, restructuring expenses, amortization of intangibles and adjusted operating income. Are you in need of a template that can accommodate all of your creative concepts This one is crafted professionally and can be altered to fit any style. Use it with Google Slides or PowerPoint. Include striking photographs, symbols, depictions, and other visuals. Fill, move around, or remove text boxes as desired. Test out color palettes and font mixtures. Edit and save your work, or work with colleagues. Download Projected Company Growth Rate Highlighting Revenue And Operating Income Ppt PowerPoint Presentation File Example File PDF and observe how to make your presentation outstanding. Give an impeccable presentation to your group and make your presentation unforgettable.

This slide highlights the projected company growth rate which highlights the revenue, operating income, acquisition related expenses, restructuring expenses, amortization of intangibles and adjusted operating income. Coming up with a presentation necessitates that the majority of the effort goes into the content and the message you intend to convey. The visuals of a PowerPoint presentation can only be effective if it supplements and supports the story that is being told. Keeping this in mind our experts created BPO Performance Improvement Action Plan Projected Company Growth Rate Highlighting Revenue And Operating Income Guidelines PDF to reduce the time that goes into designing the presentation. This way, you can concentrate on the message while our designers take care of providing you with the right template for the situation.

This slide highlights the projected company growth rate which highlights the revenue, operating income, acquisition related expenses, restructuring expenses, amortization of intangibles and adjusted operating income. Find a pre designed and impeccable Projected Company Growth Rate Highlighting Revenue And Operating Income Formats PDF. The templates can ace your presentation without additional effort. You can download these easy to edit presentation templates to make your presentation stand out from others. So, what are you waiting for Download the template from Slidegeeks today and give a unique touch to your presentation.

Are you in need of a template that can accommodate all of your creative concepts This one is crafted professionally and can be altered to fit any style. Use it with Google Slides or PowerPoint. Include striking photographs, symbols, depictions, and other visuals. Fill, move around, or remove text boxes as desired. Test out color palettes and font mixtures. Edit and save your work, or work with colleagues. Download Email Marketing Strategies To Drive Revenue Operational Areas Healthcare Template PDF and observe how to make your presentation outstanding. Give an impeccable presentation to your group and make your presentation unforgettable. The following slide showcases various email marketing strategies which can be used by the businesses to generate sales. The strategies are providing online registration, offering something in return, personalized message, scheduling the emails and conducting A B test.
Presenting Revenue Operations Driving Sales Enablement Icon Elements PDF to dispense important information. This template comprises four stages. It also presents valuable insights into the topics including Revenue Operations, Driving Sales Enablement Icon. This is a completely customizable PowerPoint theme that can be put to use immediately. So, download it and address the topic impactfully.


This slide highlights the Nielsen company revenue and operating income for the last 3 years. It includes the data in million of US dollars with a key takeaways section. Create an editable Data And Customer Analysis Company Outline Revenue And Operating Income Diagrams PDF that communicates your idea and engages your audience. Whether youre presenting a business or an educational presentation, pre designed presentation templates help save time. Data And Customer Analysis Company Outline Revenue And Operating Income Diagrams PDF is highly customizable and very easy to edit, covering many different styles from creative to business presentations. Slidegeeks has creative team members who have crafted amazing templates. So, go and get them without any delay.


This slide highlights the Dabur company financials from 2017 to 22 which includes revenue from operations, operating profit and profit after tax. Slidegeeks is here to make your presentations a breeze with Herbal Products Company Profile Revenue Operating Profit And PAT Clipart PDF With our easy to use and customizable templates, you can focus on delivering your ideas rather than worrying about formatting. With a variety of designs to choose from, you are sure to find one that suits your needs. And with animations and unique photos, illustrations, and fonts, you can make your presentation pop. So whether you are giving a sales pitch or presenting to the board, make sure to check out Slidegeeks first.


This slide showcases the revenue generated from operations for last five years from 2018 to 2022 such as consumer and enterprise platforms which shows increasing revenue year after year The best PPT templates are a great way to save time, energy, and resources. Slidegeeks have 100 percent editable powerpoint slides making them incredibly versatile. With these quality presentation templates, you can create a captivating and memorable presentation by combining visually appealing slides and effectively communicating your message. Download Online Advertising Firm Business Profile Revenue From Operations From 2018 To 2022 Ideas PDF from Slidegeeks and deliver a wonderful presentation.


This slide showcases the revenue generated from operations for last five years from 2018 to 2022 such as consumer and enterprise platforms which shows increasing revenue year after year This Information Technology Solutions Company Outline Revenue From Operations From 2018 To 2022 Professional PDF is perfect for any presentation, be it in front of clients or colleagues. It is a versatile and stylish solution for organizing your meetings. The Information Technology Solutions Company Outline Revenue From Operations From 2018 To 2022 Professional PDF features a modern design for your presentation meetings. The adjustable and customizable slides provide unlimited possibilities for acing up your presentation. Slidegeeks has done all the homework before launching the product for you. So, do not wait, grab the presentation templates today

This slide highlights the projected company growth rate which highlights the revenue, operating income, acquisition related expenses, restructuring expenses, amortization of intangibles and adjusted operating income. Whether you have daily or monthly meetings, a brilliant presentation is necessary. Projected Company Growth Rate Highlighting Revenue And Operating Income Information PDF can be your best option for delivering a presentation. Represent everything in detail using Projected Company Growth Rate Highlighting Revenue And Operating Income Information PDF and make yourself stand out in meetings. The template is versatile and follows a structure that will cater to your requirements. All the templates prepared by Slidegeeks are easy to download and edit. Our research experts have taken care of the corporate themes as well. So, give it a try and see the results.
55 Item(s)