 AI PPT Maker
 Templates
 PPT Bundles
 Design Services
 Business PPTs
 Business Plan
 Management
 Strategy
 Introduction PPT
 Roadmap
 Self Introduction
 Timelines
 Process
 Marketing
 Agenda
 Technology
 Medical
 Startup Business Plan
 Cyber Security
 Dashboards
 SWOT
SWOT Proposals
 Education
 Pitch Deck
 Digital Marketing
 KPIs
KPIs Project Management
 Product Management
 Artificial Intelligence
 Target Market
 Communication
 Supply Chain
 Google Slides
 Research Services
 One Pagers
 All Categories
Revenue Analysis PowerPoint Presentation Templates and Google Slides
SHOW
- 60
- 120
- 180
DISPLAYING: 60 of 92 Item(s)
Page


Share a great deal of information on the topic by deploying this Revenue Comparative Analysis Ppt PowerPoint Presentation Complete With Slides. Support your ideas and thought process with this prefabricated set. It includes a set of tweleve slides, all fully modifiable and editable. Each slide can be restructured and induced with the information and content of your choice. You can add or remove large content boxes as well, to make this PPT slideshow more personalized. Its high-quality graphics and visuals help in presenting a well-coordinated pitch. This PPT template is also a resourceful tool to take visual cues from and implement the best ideas to help your business grow and expand. The main attraction of this well-formulated deck is that everything is editable, giving you the freedom to adjust it to your liking and choice. Changes can be made in the background and theme as well to deliver an outstanding pitch. Therefore, click on the download button now to gain full access to this multifunctional set.


Share a great deal of information on the topic by deploying this competitors revenue statement analysis expenses ppt powerpoint presentation complete deck with slides. Support your ideas and thought process with this prefabricated set. It includes a set of twelve slides, all fully modifiable and editable. Each slide can be restructured and induced with the information and content of your choice. You can add or remove large content boxes as well, to make this PPT slideshow more personalized. Its high-quality graphics and visuals help in presenting a well-coordinated pitch. This PPT template is also a resourceful tool to take visual cues from and implement the best ideas to help your business grow and expand. The main attraction of this well-formulated deck is that everything is editable, giving you the freedom to adjust it to your liking and choice. Changes can be made in the background and theme as well to deliver an outstanding pitch. Therefore, click on the download button now to gain full access to this multifunctional set.


This is a financials base plan for revenue analysis powerpoint slide graphics. This is a three stage process. The stages in this process are kp, revenue, cost of sales, gross profit, customer acquisition cost, other operating cost expense, operating profit, change in cash, ending cash, employees ftes.


This is a market size segmentation with revenue analysis ppt design. This is a two stage process. The stages in this process are in team of users, in team of revenue from customers, target market target market, tam, sam, we are planning to acquire users first and then paid customer, advertisers, event organizers, mentors.


This slide showcases an analysis of current market share and revenue of own brand and competitors to ascertain position within the industry with relevant key insights. The best PPT templates are a great way to save time, energy, and resources. Slidegeeks have 100 percent editable powerpoint slides making them incredibly versatile. With these quality presentation templates, you can create a captivating and memorable presentation by combining visually appealing slides and effectively communicating your message. Download Enterprise Leaders Technique To Achieve Market Control Current Market Share And Revenue Analysis Brochure PDF from Slidegeeks and deliver a wonderful presentation.


This slide showcases dashboard that can help restaurant keep track of revenue generated from food and beverages. Its key elements are revenue by location, top expenses, revenue by type etc Are you in need of a template that can accommodate all of your creative concepts This one is crafted professionally and can be altered to fit any style. Use it with Google Slides or PowerPoint. Include striking photographs, symbols, depictions, and other visuals. Fill, move around, or remove text boxes as desired. Test out color palettes and font mixtures. Edit and save your work, or work with colleagues. Download Marketing Initiatives To Promote Fast Food Cafe Food And Beverages Revenue Analysis Dashboard Demonstration PDF and observe how to make your presentation outstanding. Give an impeccable presentation to your group and make your presentation unforgettable.


This slide represents neighborhood assessment that helps investors to calculate investment potential for a property. It covers home value, population, employment rate, income level etc. Do you have an important presentation coming up Are you looking for something that will make your presentation stand out from the rest Look no further than Strategies For Flipping Houses For Maximum Revenue Neighborhood Analysis To Assess Investment Potential Rules PDF. With our professional designs, you can trust that your presentation will pop and make delivering it a smooth process. And with Slidegeeks, you can trust that your presentation will be unique and memorable. So why wait Grab Strategies For Flipping Houses For Maximum Revenue Neighborhood Analysis To Assess Investment Potential Rules PDF today and make your presentation stand out from the rest.
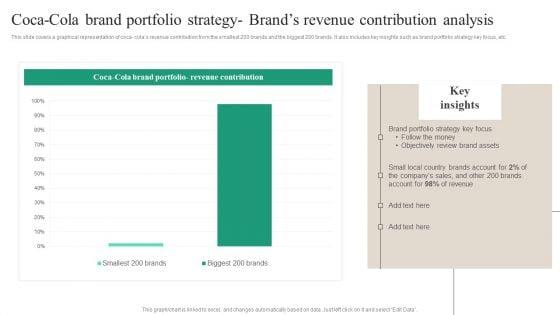

This slide covers a graphical representation of coca- colas revenue contribution from the smallest 200 brands and the biggest 200 brands. It also includes key insights such as brand portfolio strategy key focus, etc. Take your projects to the next level with our ultimate collection of Coca Cola Brand Portfolio Strategy Brands Revenue Contribution Analysis Formats PDF. Slidegeeks has designed a range of layouts that are perfect for representing task or activity duration, keeping track of all your deadlines at a glance. Tailor these designs to your exact needs and give them a truly corporate look with your own brand colors they will make your projects stand out from the rest.


This slide showcase revenue trends of four different product and suggestions to boost revenue. It includes elements such as product A, product B , product C, product D along with key highlights and revenue projection. Showcasing this set of slides titled Financial Revenue Trends Analysis Performance Report Designs PDF. The topics addressed in these templates are Revenue, Innovative Design, Latest Trend. All the content presented in this PPT design is completely editable. Download it and make adjustments in color, background, font etc. as per your unique business setting.


This slide showcases dashboard that can help organization to analyze the total products shipped of different categories and identify the revenue generated. Its key components are warehousing costs, number of items in stock and total revenue. Pitch your topic with ease and precision using this Product Logistics Management And Revenue Analysis Dashboard Demonstration PDF. This layout presents information on Warehouse Costs, Shipping Revenue Country, Shipped Products . It is also available for immediate download and adjustment. So, changes can be made in the color, design, graphics or any other component to create a unique layout.


This slide showcases shipping dashboard that can help company to calculate the revenue generated from delivered products and track the monthly order status. Its key components are highest revenue days, subscription revenue, order status, order revenue and transaction paid status. Showcasing this set of slides titled Logistics Management Revenue Analysis Dashboard With Orders Revenue Brochure PDF. The topics addressed in these templates are Order Revenue, Transaction Paid, Subscription Revenue. All the content presented in this PPT design is completely editable. Download it and make adjustments in color, background, font etc. as per your unique business setting.


This one page covers about quarterly revenue generations comparable with previous year and revenue analysis from various channels. Presenting you an exemplary Quarterly Sales Performance In Comparison With Revenue Analysis One Pager Documents. Our one-pager comprises all the must-have essentials of an inclusive document. You can edit it with ease, as its layout is completely editable. With such freedom, you can tweak its design and other elements to your requirements. Download this Quarterly Sales Performance In Comparison With Revenue Analysis One Pager Documents brilliant piece now.


This slide showcases dashboard that can help restaurant to keep track revenue generated from food and beverages. Its key elements are revenue by location, top expenses, revenue by type etc. This Strategic Promotional Guide For Restaurant Business Advertising Food And Beverages Revenue Analysis Dashboard Template PDF from Slidegeeks makes it easy to present information on your topic with precision. It provides customization options, so you can make changes to the colors, design, graphics, or any other component to create a unique layout. It is also available for immediate download, so you can begin using it right away. Slidegeeks has done good research to ensure that you have everything you need to make your presentation stand out. Make a name out there for a brilliant performance.


The following slide showcases financial waterfall for revenue growth in electronics industry. It presents information related to percentage increase in sales, net sales, etc. Showcasing this set of slides titled Financial Waterfall Model Revenue Growth Analysis Professional PDF. The topics addressed in these templates are Financial, Revenue Growth, Analysis. All the content presented in this PPT design is completely editable. Download it and make adjustments in color, background, font etc. as per your unique business setting.
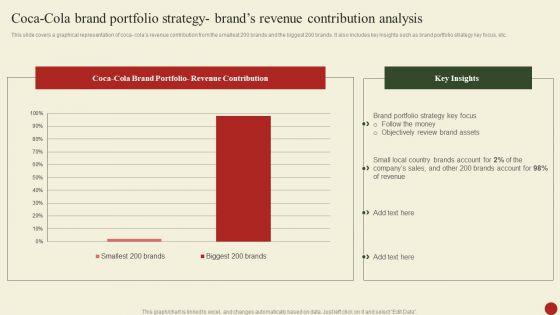
This slide covers a graphical representation of coca- colas revenue contribution from the smallest 200 brands and the biggest 200 brands. It also includes key insights such as brand portfolio strategy key focus, etc. From laying roadmaps to briefing everything in detail, our templates are perfect for you. You can set the stage with your presentation slides. All you have to do is download these easy-to-edit and customizable templates. Coca Cola Brand Portfolio Strategy Brands Revenue Contribution Analysis Ideas PDF will help you deliver an outstanding performance that everyone would remember and praise you for. Do download this presentation today.


This slide showcases dashboard that can help restaurant keep track of revenue generated from food and beverages. Its key elements are revenue by location, top expenses, revenue by type etc.The best PPT templates are a great way to save time, energy, and resources. Slidegeeks have 100precent editable powerpoint slides making them incredibly versatile. With these quality presentation templates, you can create a captivating and memorable presentation by combining visually appealing slides and effectively communicating your message. Download Digital Marketing Plan For Restaurant Business Food And Beverages Revenue Analysis Dashboard Template PDF from Slidegeeks and deliver a wonderful presentation.


This slide provides dashboard showcasing product development project overview with completion status. It provides information regarding cash flow statements, completion progress, project overview and product approval status. Pitch your topic with ease and precision using this KPI Dashboard Showcasing Product Management Revenue Analysis Portrait PDF. This layout presents information on Completion Progress, Product Approval Status, Cash Flow Statements. It is also available for immediate download and adjustment. So, changes can be made in the color, design, graphics or any other component to create a unique layout.


This slide covers sales and revenue generated by a business entity. It also includes elements such profits earned, cost incurred, marketing and sales cost breakdown, annual sales revenue graph, sales generated through social media, revenue from up OR cross selling, etc. Pitch your topic with ease and precision using this Company Sales And Revenue Performance Analysis Ppt Ideas Format PDF. This layout presents information on Total Sales, Revenue Generation, Profit Earned, Cost Incurred. It is also available for immediate download and adjustment. So, changes can be made in the color, design, graphics or any other component to create a unique layout.


This slide shows comparison of revenue generated by various products during four quarters. Product B is the highest selling product of organization where as Product C is the product with lowest sales. Showcasing this set of slides titled Quarterly E Commerce Products Revenue Analysis Chart Guidelines PDF. The topics addressed in these templates are Revenue USD, Product, Continuous Quality Improvement. All the content presented in this PPT design is completely editable. Download it and make adjustments in color, background, font etc. as per your unique business setting.


This slide shows dashboard which can be used by organizations to monitor ecommerce revenue analysis. It includes metrics such as orders, purchases, delivery status etc. Pitch your topic with ease and precision using this KPI Dashboard To Track E Commerce Business Revenue Analysis Rules PDF. This layout presents information on Total Purchases, Total Sales, Pending Delivery, Collection. It is also available for immediate download and adjustment. So, changes can be made in the color, design, graphics or any other component to create a unique layout.


This slide shows the key performance indicators dashboard which can be used to analyze current financial position of e-commerce business. It includes metrics such as revenue, expenses, profit, cash in hand, etc. Showcasing this set of slides titled KPI Dashboard To Monitor E Commerce Revenue Analysis Performance Mockup PDF. The topics addressed in these templates are Accounts Receivable, Accounts Payable, Revenue, Expenses. All the content presented in this PPT design is completely editable. Download it and make adjustments in color, background, font etc. as per your unique business setting.


This slide shows the comparison between actual and forecasted revenue of e-commerce company products. Showcasing this set of slides titled Actual And Forecasted E Commerce Revenue Analysis Comparison Clipart PDF. The topics addressed in these templates are Actual Revenue, Forecasted Revenue, Bearish Market. All the content presented in this PPT design is completely editable. Download it and make adjustments in color, background, font etc. as per your unique business setting.
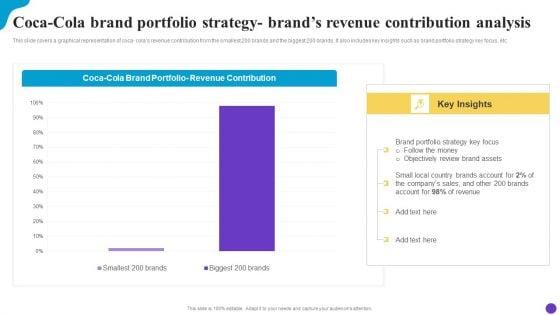
This slide covers a graphical representation of coca- colas revenue contribution from the smallest 200 brands and the biggest 200 brands. It also includes key insights such as brand portfolio strategy key focus, etc.Whether you have daily or monthly meetings, a brilliant presentation is necessary. Coca Cola Brand Portfolio Strategy Brands Revenue Contribution Analysis Brand Profile Strategy Guide To Expand Portrait PDF can be your best option for delivering a presentation. Represent everything in detail using Coca Cola Brand Portfolio Strategy Brands Revenue Contribution Analysis Brand Profile Strategy Guide To Expand Portrait PDF and make yourself stand out in meetings. The template is versatile and follows a structure that will cater to your requirements. All the templates prepared by Slidegeeks are easy to download and edit. Our research experts have taken care of the corporate themes as well. So, give it a try and see the results.


This slide showcases annual report for construction company that provide public disclosure of a organization operating and financial activities. Its key components are growth strategies, financial review, and revenue analysis. Showcasing this set of slides titled Yearly Report For Construction Organization With Revenue Analysis Topics PDF. The topics addressed in these templates are Revenue Analysis, Growth Strategies, Customers. All the content presented in this PPT design is completely editable. Download it and make adjustments in color, background, font etc. as per your unique business setting.
This slide illustrates finance process dashboard indicating yearly revenue analysis which contains gross profit margin, operating profit ratio, net profit, revenue and cost of goods sold cogs operating expenses, etc. It can be referred by company owners who can compare it with previous years performance and make related decisions for future. Showcasing this set of slides titled Financial Procedure Dashboard Indicating Yearly Revenue Analysis Icons PDF. The topics addressed in these templates are Operating Profit Percentage, Net Profit Percentage, Operating Profit Ratio. All the content presented in this PPT design is completely editable. Download it and make adjustments in color, background, font etc. as per your unique business setting.


The following slide highlights the KPAs of revenue assessment to ascertain overall business performance and improve growth strategies. It includes KPIs such as total, actual versus budgeted quarter wise revenue, top customers etc. Showcasing this set of slides titled Quarterly Business Revenue Analysis Kpis Slides PDF. The topics addressed in these templates are Quarter Wise Revenue, Customers, Budgeted Quarter. All the content presented in this PPT design is completely editable. Download it and make adjustments in color, background, font etc. as per your unique business setting.


This is a Global Auto Sales Scorecard With Revenue Analysis Rules PDF template with various stages. Focus and dispense information on six stages using this creative set, that comes with editable features. It contains large content boxes to add your information on topics like Global Auto Sales, Scorecard Revenue Analysis. You can also showcase facts, figures, and other relevant content using this PPT layout. Grab it now.


This slide illustrates graphical representation of revenue of three brands. It includes weekly revenue line graphs and net promoter score by age of customers.Pitch your topic with ease and precision using this Brand Revenue Comparative Analysis With Net Promoter Score Dashboard Mockup PDF. This layout presents information on Brand Revenue Comparative Analysis With Net Promoter Score Dashboard. It is also available for immediate download and adjustment. So, changes can be made in the color, design, graphics or any other component to create a unique layout.


This slide illustrates graphical representation of sales revenue of three brands. It includes insights and facts and figures of these brands.Showcasing this set of slides titled Brand Revenue Comparative Analysis Graph With Key Insights Inspiration PDF. The topics addressed in these templates are Brand Revenue Comparative Analysis Graph With Key Insights. All the content presented in this PPT design is completely editable. Download it and make adjustments in color, background, font etc. as per your unique business setting.


This slide showcases Business Revenue Tree that can help ecommerce business to identify the sources of revenue generation. It also showcases expenses incurred by online business in its course of operation. Persuade your audience using this ecommerce business revenue tree analysis with website expenses professional pdf. This PPT design covers one stage, thus making it a great tool to use. It also caters to a variety of topics including ecommerce business revenue tree analysis with website expenses. Download this PPT design now to present a convincing pitch that not only emphasizes the topic but also showcases your presentation skills.


This slide showcases Business Revenue Tree that can help organization to identify the revenues generated from mobile application installs from different sources. It also outlines fixed and variable expenses incurred tin application maintenance. Presenting business revenue tree analysis for mobile application downloads designs pdf to dispense important information. This template comprises one stage. It also presents valuable insights into the topics including business revenue tree analysis for mobile application downloads. This is a completely customizable PowerPoint theme that can be put to use immediately. So, download it and address the topic impactfully.


Presenting sales rep scorecard team global sales scorecard with revenue analysis structure pdf to provide visual cues and insights. Share and navigate important information on six stages that need your due attention. This template can be used to pitch topics like team global sales scorecard with revenue analysis. In addtion, this PPT design contains high resolution images, graphics, etc, that are easily editable and available for immediate download.


Following slide outlines a revenue analysis dashboard showcasing the business results after implementing marketing strategy. It provides information about total revenue for the month, revenue for year to date, revenue trend, product revenue and services revenue etc. Pitch your topic with ease and precision using this revenue analysis kpi dashboard post building marketing strategy infographics pdf. This layout presents information on revenue analysis kpi dashboard post building marketing strategy. It is also available for immediate download and adjustment. So, changes can be made in the color, design, graphics or any other component to create a unique layout.


This slide provides information determining role of decision maker in buying process. Several decision makers are assessed on parameters such as influence level, buy in, etc. Deliver an awe inspiring pitch with this creative how to administer accounts to increase sales revenue analysis matrix for decision maker summary pdf bundle. Topics like product, marketing functionality, data security can be discussed with this completely editable template. It is available for immediate download depending on the needs and requirements of the user.


Deliver an awe inspiring pitch with this creative product social sustainability scorecard with revenue trend analysis download pdf bundle. Topics like product social sustainability scorecard with revenue trend analysis can be discussed with this completely editable template. It is available for immediate download depending on the needs and requirements of the user.
Deliver and pitch your topic in the best possible manner with this business management dashboards revenue business analysis method ppt inspiration icon pdf. Use them to share invaluable insights on cost, revenue, acquisition, revenue, target and impress your audience. This template can be altered and modified as per your expectations. So, grab it now.
Presenting Pie Chart For Revenue Analysis Vector Icon Ppt Outline Slides PDF to dispense important information. This template comprises three stages. It also presents valuable insights into the topics including pie chart for revenue analysis vector icon. This is a completely customizable PowerPoint theme that can be put to use immediately. So, download it and address the topic impactfully.


Showcasing this set of slides titled business net revenue analysis chart with source ppt powerpoint presentation gallery graphics design pdf. The topics addressed in these templates are revenue source, 2018 to 2020. All the content presented in this PPT design is completely editable. Download it and make adjustments in color, background, font etc. as per your unique business setting.


Presenting this set of slides with name bar graph revenue performance analysis ppt powerpoint presentation pictures samples pdf. The topics discussed in these slide is bar graph revenue performance analysis. This is a completely editable PowerPoint presentation and is available for immediate download. Download now and impress your audience.


Presenting this set of slides with name scatter plot chart for revenue analysis ppt powerpoint presentation show graphics example pdf. The topics discussed in these slides are satisfaction index, revenue. This is a completely editable PowerPoint presentation and is available for immediate download. Download now and impress your audience.


Presenting this set of slides with name enterprise revenue management analysis ppt powerpoint presentation infographic template mockup cpb pdf. This is an editable Powerpoint one stages graphic that deals with topics like enterprise revenue management analysis to help convey your message better graphically. This product is a premium product available for immediate download and is 100 percent editable in Powerpoint. Download this now and use it in your presentations to impress your audience.


Presenting this set of slides with name revenue analysis ppt powerpoint presentation gallery example cpb. This is an editable Powerpoint eight stages graphic that deals with topics like revenue analysis to help convey your message better graphically. This product is a premium product available for immediate download and is 100 percent editable in Powerpoint. Download this now and use it in your presentations to impress your audience.


Presenting this set of slides with name yearly sales revenue analysis template ppt powerpoint presentation summary template. The topics discussed in these slides are price per unit, yearly sales, revenue analysis. This is a completely editable PowerPoint presentation and is available for immediate download. Download now and impress your audience.
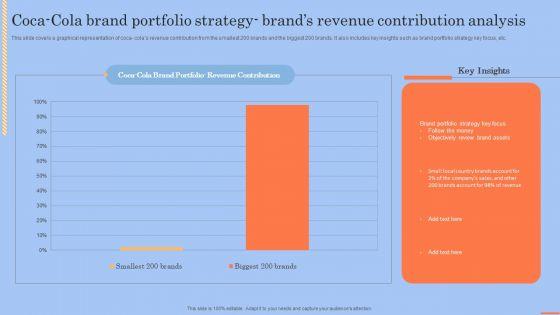


This slide covers a graphical representation of coca- colas revenue contribution from the smallest 200 brands and the biggest 200 brands. It also includes key insights such as brand portfolio strategy key focus, etc. There are so many reasons you need a Coca Cola Brand Portfolio Strategy Brands Revenue Contribution Analysis Themes PDF. The first reason is you can not spend time making everything from scratch, Thus, Slidegeeks has made presentation templates for you too. You can easily download these templates from our website easily.

Present like a pro with Spa Marketing Strategy To Boost Reservations And Enhance Revenue Swot Analysis Themes PDF Create beautiful presentations together with your team, using our easy to use presentation slides. Share your ideas in real time and make changes on the fly by downloading our templates. So whether you are in the office, on the go, or in a remote location, you can stay in sync with your team and present your ideas with confidence. With Slidegeeks presentation got a whole lot easier. Grab these presentations today.

This slide highlights various metrics to determine performance gaps in actual and desired results of spa and wellness business. It showcases KPIs such as revenue, occupancy rate, average ticket value, customer satisfaction, customer retention rate, employee satisfaction, COGS, gross margin, marketing ROI and website traffic. Present like a pro with Spa Marketing Strategy Boost Reservations Enhance Revenue Gap Analysis Of Actual Desired Results Inspiration PDF Create beautiful presentations together with your team, using our easy to use presentation slides. Share your ideas in real time and make changes on the fly by downloading our templates. So whether you are in the office, on the go, or in a remote location, you can stay in sync with your team and present your ideas with confidence. With Slidegeeks presentation got a whole lot easier. Grab these presentations today.

The following slide presents a matrix showing competitive assessment to determine own business position against other rivalry companies operating in similar industry. It highlights components such as competitor, customer acquisition, customer acquisition rate, customer satisfaction rate, product and service differentiation and brand recognition and reputation. There are so many reasons you need a Spa Marketing Strategy Boost Reservations Enhance Revenue Competitive Analysis Understand Inspiration PDF. The first reason is you cannot spend time making everything from scratch, Thus, Slidegeeks has made presentation templates for you too. You can easily download these templates from our website easily.
SHOW
- 60
- 120
- 180
DISPLAYING: 60 of 92 Item(s)
Page