 AI PPT Maker
 Templates
 PPT Bundles
 Design Services
 Business PPTs
 Business Plan
 Management
 Strategy
 Introduction PPT
 Roadmap
 Self Introduction
 Timelines
 Process
 Marketing
 Agenda
 Technology
 Medical
 Startup Business Plan
 Cyber Security
 Dashboards
 SWOT
SWOT Proposals
 Education
 Pitch Deck
 Digital Marketing
 KPIs
KPIs Project Management
 Product Management
 Artificial Intelligence
 Target Market
 Communication
 Supply Chain
 Google Slides
 Research Services
 One Pagers
 All Categories
Metrics Dashboard PowerPoint Presentation Templates and Google Slides
SHOW
- 60
- 120
- 180
DISPLAYING: 60 of 433 Item(s)
Page


Improve your presentation delivery using this Project Metrics Dashboard Ppt PowerPoint Presentation Complete With Slides. Support your business vision and objectives using this well-structured PPT deck. This template offers a great starting point for delivering beautifully designed presentations on the topic of your choice. Comprising sixty three this professionally designed template is all you need to host discussion and meetings with collaborators. Each slide is self-explanatory and equipped with high-quality graphics that can be adjusted to your needs. Therefore, you will face no difficulty in portraying your desired content using this PPT slideshow. This PowerPoint slideshow contains every important element that you need for a great pitch. It is not only editable but also available for immediate download and utilization. The color, font size, background, shapes everything can be modified to create your unique presentation layout. Therefore, download it now.


If designing a presentation takes a lot of your time and resources and you are looking for a better alternative, then this Risk Metrics Dashboard Ppt PowerPoint Presentation Complete With Slides is the right fit for you. This is a prefabricated set that can help you deliver a great presentation on the topic. All the fourteen slides included in this sample template can be used to present a birds-eye view of the topic. These slides are also fully editable, giving you enough freedom to add specific details to make this layout more suited to your business setting. Apart from the content, all other elements like color, design, theme are also replaceable and editable. This helps in designing a variety of presentations with a single layout. Not only this, you can use this PPT design in formats like PDF, PNG, and JPG once downloaded. Therefore, without any further ado, download and utilize this sample presentation as per your liking.


If designing a presentation takes a lot of your time and resources and you are looking for a better alternative, then this online marketing metrics and kpis campaigns goals ppt powerpoint presentation complete deck is the right fit for you. This is a prefabricated set that can help you deliver a great presentation on the topic. All the twelve slides included in this sample template can be used to present a birds-eye view of the topic. These slides are also fully editable, giving you enough freedom to add specific details to make this layout more suited to your business setting. Apart from the content, all other elements like color, design, theme are also replaceable and editable. This helps in designing a variety of presentations with a single layout. Not only this, you can use this PPT design in formats like PDF, PNG, and JPG once downloaded. Therefore, without any further ado, download and utilize this sample presentation as per your liking.


This slide represents the dashboard to track and manage customer relationship management marketing attribution campaign. It includes details related to KPIs such as acquisition funnel overview, MQL, SQL, opportunities and customers by channel. Are you in need of a template that can accommodate all of your creative concepts This one is crafted professionally and can be altered to fit any style. Use it with Google Slides or PowerPoint. Include striking photographs, symbols, depictions, and other visuals. Fill, move around, or remove text boxes as desired. Test out color palettes and font mixtures. Edit and save your work, or work with colleagues. Download Integrating CRM Solution To Acquire Potential Customers CRM Marketing Attribution Key Metrics Dashboard Template PDF and observe how to make your presentation outstanding. Give an impeccable presentation to your group and make your presentation unforgettable.


This slide covers dashboard to track effectiveness of referral program. It includes elements such as total revenue generation, MRR, total paying customers. It also includes total revenue earned and clicks, new referrals received, etc. This Referral Metrics Dashboard To Measure Program Performance Ppt PowerPoint Presentation Diagram Lists PDF from Slidegeeks makes it easy to present information on your topic with precision. It provides customization options, so you can make changes to the colors, design, graphics, or any other component to create a unique layout. It is also available for immediate download, so you can begin using it right away. Slidegeeks has done good research to ensure that you have everything you need to make your presentation stand out. Make a name out there for a brilliant performance.
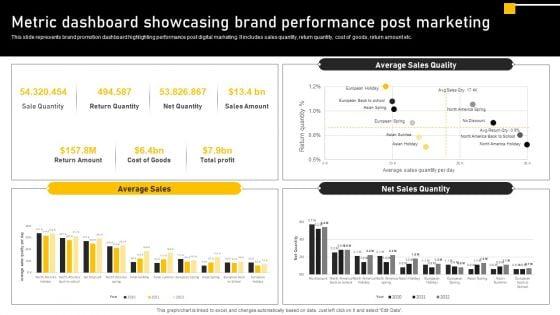

This slide represents brand promotion dashboard highlighting performance post digital marketing. It includes sales quantity, return quantity, cost of goods, return amount etc. Do you have to make sure that everyone on your team knows about any specific topic I yes, then you should give Online Ads Strategic Plan For Effective Marketing Metric Dashboard Showcasing Brand Performance Post Themes PDF a try. Our experts have put a lot of knowledge and effort into creating this impeccable Online Ads Strategic Plan For Effective Marketing Metric Dashboard Showcasing Brand Performance Post Themes PDF. You can use this template for your upcoming presentations, as the slides are perfect to represent even the tiniest detail. You can download these templates from the Slidegeeks website and these are easy to edit. So grab these today.


This slide represents lean manufacturing dashboard for performance measurement. It covers equipment status timeline, downtime etc Want to ace your presentation in front of a live audience Our Production Metric Dashboard For Equipment Performance Measurement Slides PDF can help you do that by engaging all the users towards you. Slidegeeks experts have put their efforts and expertise into creating these impeccable powerpoint presentations so that you can communicate your ideas clearly. Moreover, all the templates are customizable, and easy to edit and downloadable. Use these for both personal and commercial use.
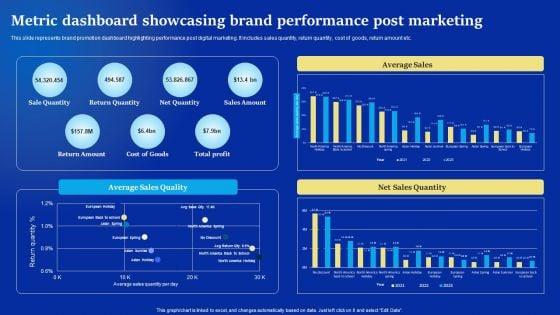
This slide represents brand promotion dashboard highlighting performance post digital marketing. It includes sales quantity, return quantity, cost of goods, return amount etc. There are so many reasons you need a Online Advertising Campaign For Brand Recognition Metric Dashboard Showcasing Brand Performance Structure PDF. The first reason is you cannot spend time making everything from scratch, Thus, Slidegeeks has made presentation templates for you too. You can easily download these templates from our website easily.


This slide provides information regarding essential characteristics of co-branding in terms of strategic partnership, build credibility, developing marketing strategy, develop innovation and value addition, etc. Make sure to capture your audiences attention in your business displays with our gratis customizable Performance Metrics Dashboard To Track Overall Rebranding Effectiveness Professional PDF. These are great for business strategies, office conferences, capital raising or task suggestions. If you desire to acquire more customers for your tech business and ensure they stay satisfied, create your own sales presentation with these plain slides.


This slide represents KPI dashboard for tracking supplier diversity in organization and measure performance. It provides information regarding organization spending cost, supplier count, diversity type, status etc. Pitch your topic with ease and precision using this Metric Dashboard To Track Supplier Diversity And Performance Designs PDF. This layout presents information on Diversity Type, Diversity Status, Diverse Supplier. It is also available for immediate download and adjustment. So, changes can be made in the color, design, graphics or any other component to create a unique layout.
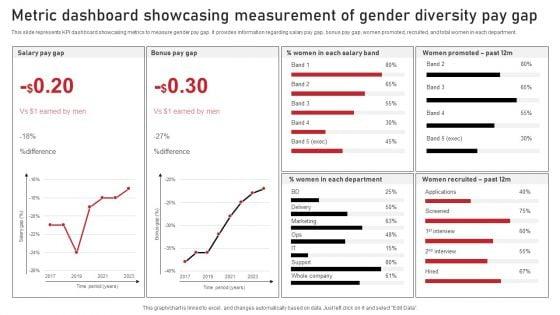
This slide represents KPI dashboard showcasing metrics to measure gender pay gap. It provides information regarding salary pay gap, bonus pay gap, women promoted, recruited, and total women in each department. Pitch your topic with ease and precision using this Metric Dashboard Showcasing Measurement Of Gender Diversity Pay Gap Sample PDF. This layout presents information on Marketing, Screened, Delivery. It is also available for immediate download and adjustment. So, changes can be made in the color, design, graphics or any other component to create a unique layout.
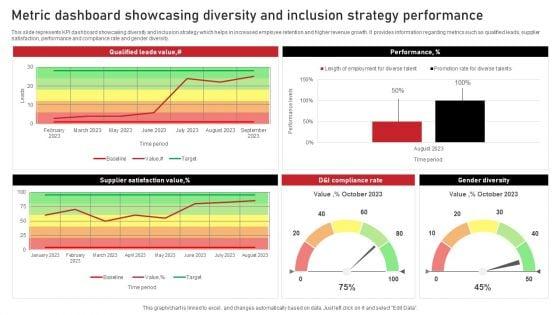
This slide represents KPI dashboard showcasing diversity and inclusion strategy which helps in increased employee retention and higher revenue growth. It provides information regarding metrics such as qualified leads, supplier satisfaction, performance and compliance rate and gender diversity. Showcasing this set of slides titled Metric Dashboard Showcasing Diversity And Inclusion Strategy Performance Background PDF. The topics addressed in these templates are Performance, Gender Diversity, Performance. All the content presented in this PPT design is completely editable. Download it and make adjustments in color, background, font etc. as per your unique business setting.


This slide showcases dashboard of human resource that can help HR manager to track change in KPIs as compared to previous month. Its key components are training effectiveness, 90 days quit rate and acceptance ratio. Pitch your topic with ease and precision using this Human Resource Metrics Dashboard With Engagement Index Guidelines PDF. This layout presents information on Absence Rate, Absence Cost, Benefits Satisfaction. It is also available for immediate download and adjustment. So, changes can be made in the color, design, graphics or any other component to create a unique layout.


This slide showcases dashboard for human resource KPIs that can help HR manager to keep track of key performance indicators and hiring expenses. Its key elements are employee count, hiring process satisfaction rate, average time to hire, offer acceptance rate, average time to hire and cost per hire. Showcasing this set of slides titled Human Resource Metrics Dashboard With Cost Per Hire Portrait PDF. The topics addressed in these templates are Employee Count, Offer Acceptance Rate, Cost Per Hire. All the content presented in this PPT design is completely editable. Download it and make adjustments in color, background, font etc. as per your unique business setting.


This slide represents KPI dashboard to track product performance in the market. It covers various metrics such as customers, vendor, product category, revenue etc. Slidegeeks has constructed Management Plan For Product Life Cycle Metric Dashboard To Track Product Performance Infographics PDF after conducting extensive research and examination. These presentation templates are constantly being generated and modified based on user preferences and critiques from editors. Here, you will find the most attractive templates for a range of purposes while taking into account ratings and remarks from users regarding the content. This is an excellent jumping-off point to explore our content and will give new users an insight into our top-notch PowerPoint Templates.


This slide showcases KPI dashboard for monitoring financial health of business to ensure smooth flow of business operations. It includes details such as COGS, net profit, cost breakdown, etc. Showcasing this set of slides titled Monthly Financial Metrics Dashboard With Revenue And Expenditure Rules PDF. The topics addressed in these templates are Net Profit, Costs, Expenditure. All the content presented in this PPT design is completely editable. Download it and make adjustments in color, background, font etc. as per your unique business setting.


This slide showcases a KPI dashboard to review current financial performance of the company. It includes information such as revenue breakdown, expenses and costs, operating income, net profit, etc. Pitch your topic with ease and precision using this Monthly Financial Metrics Dashboard With Revenue And Cost Breakdown Information PDF. This layout presents information on Operating Income, Operating Margin, Net Profit. It is also available for immediate download and adjustment. So, changes can be made in the color, design, graphics or any other component to create a unique layout.


This following slide displays kpis to communicate key financial information to both internal and external stakeholders. It further includes details such as OPEX ratio, revenue and COGS, income, expenses, etc. Showcasing this set of slides titled Monthly Financial Metrics Dashboard With Income Statement Infographics PDF. The topics addressed in these templates are Gross Profit Margin, Taxes, Revenue. All the content presented in this PPT design is completely editable. Download it and make adjustments in color, background, font etc. as per your unique business setting.


Mentioned slide outlines a key performance indicator KPI dashboard which will assist managers to showcase the result of customer attrition prevention strategies. The KPIs are risky customers, retention rate, monthly recurring revenue MRR, churn risk by location and income, etc. This Kpi Metrics Dashboard To Measure Success Of Customer Churn Prevention Strategies Ppt PowerPoint Presentation File Model PDF from Slidegeeks makes it easy to present information on your topic with precision. It provides customization options, so you can make changes to the colors, design, graphics, or any other component to create a unique layout. It is also available for immediate download, so you can begin using it right away. Slidegeeks has done good research to ensure that you have everything you need to make your presentation stand out. Make a name out there for a brilliant performance.


This slide presents experiential marketing metrics with effectiveness of virtual reality and live events that help brands to generate high number of leads. It includes most demanded VR experience by customers, effectiveness of live events for brands and lead generation through experiential marketing. Pitch your topic with ease and precision using this Metrics And Kpis In Experiential Marketing Campaign Structure PDF. This layout presents information on Experiential Marketing, Business, Metrics. It is also available for immediate download and adjustment. So, changes can be made in the color, design, graphics or any other component to create a unique layout.


The purpose of this slide is to outline key performance indicator KPI dashboard which will assist the marketer to analyze mobile search engine optimization SEO performance. The key metrics mentioned in the slide are total sessions, search engine rankings etc. Take your projects to the next level with our ultimate collection of Introduction To Mobile SEM KPI Metrics Dashboard To Monitor Mobile SEO Performance Diagrams PDF. Slidegeeks has designed a range of layouts that are perfect for representing task or activity duration, keeping track of all your deadlines at a glance. Tailor these designs to your exact needs and give them a truly corporate look with your own brand colors they will make your projects stand out from the rest.


This slide provides an overview of the various KPIs tracked by the procurement department to determine the status. Major performance indicators covered are total, contracted and unlisted suppliers, rate of contract compliance, cycle time, total spending and savings. Slidegeeks has constructed Performance Metrics Dashboard Of Procurement Department Download PDF after conducting extensive research and examination. These presentation templates are constantly being generated and modified based on user preferences and critiques from editors. Here, you will find the most attractive templates for a range of purposes while taking into account ratings and remarks from users regarding the content. This is an excellent jumping off point to explore our content and will give new users an insight into our top notch PowerPoint Templates.


The purpose of this slide is to highlight performance KPI dashboard used to monitor the cyber threat management. The metrics highlighted in the slide are risk score, compliance status, threat level, monitoring and operational status. Formulating a presentation can take up a lot of effort and time, so the content and message should always be the primary focus. The visuals of the PowerPoint can enhance the presenters message, so our Kpi Metrics Dashboard To Effectively Track Cyber Threat Management Ppt Styles Guide PDF was created to help save time. Instead of worrying about the design, the presenter can concentrate on the message while our designers work on creating the ideal templates for whatever situation is needed. Slidegeeks has experts for everything from amazing designs to valuable content, we have put everything into Kpi Metrics Dashboard To Effectively Track Cyber Threat Management Ppt Styles Guide PDF.


The purpose of this slide is to outline key performance indicator KPI dashboard showcasing the results post resolving organizational conflicts. The metrics covered in this slide are conflicts by departments, conflicts logged by gender etc. Do you have to make sure that everyone on your team knows about any specific topic I yes, then you should give Conflict Resolution Method KPI Metrics Dashboard Post Resolving Workplace Download PDF a try. Our experts have put a lot of knowledge and effort into creating this impeccable Conflict Resolution Method KPI Metrics Dashboard Post Resolving Workplace Download PDF. You can use this template for your upcoming presentations, as the slides are perfect to represent even the tiniest detail. You can download these templates from the Slidegeeks website and these are easy to edit. So grab these today.


This slide represents the KPI dashboard to track and monitor performance of data driven marketing campaigns launched by the marketing team. It includes details related to conversions by google ads, Facebook and Instagram etc. There are so many reasons you need a Data Driven Marketing Campaigns Key Metrics Dashboard Microsoft PDF. The first reason is you can not spend time making everything from scratch, Thus, Slidegeeks has made presentation templates for you too. You can easily download these templates from our website easily.


The purpose of this slide is to outline key performance indicator KPI dashboard showcasing the results post resolving organizational conflicts. The metrics covered in this slide are conflicts by departments, conflicts logged by gender etc. Do you know about Slidesgeeks Kpi Metrics Dashboard Post Resolving Workplace Conflict Microsoft PDF These are perfect for delivering any kind od presentation. Using it, create PowerPoint presentations that communicate your ideas and engage audiences. Save time and effort by using our pre designed presentation templates that are perfect for a wide range of topic. Our vast selection of designs covers a range of styles, from creative to business, and are all highly customizable and easy to edit. Download as a PowerPoint template or use them as Google Slides themes.


This slide represents brand promotion dashboard highlighting performance post digital marketing. It includes sales quantity, return quantity, cost of goods, return amount etc. From laying roadmaps to briefing everything in detail, our templates are perfect for you. You can set the stage with your presentation slides. All you have to do is download these easy to edit and customizable templates. Guide Digital Advertising Optimize Lead Targeting Metric Dashboard Showcasing Brand Performance Post Slides PDF will help you deliver an outstanding performance that everyone would remember and praise you for. Do download this presentation today.


Mentioned slide outlines a key performance indicator KPI dashboard which will assist managers to showcase the result of customer attrition prevention strategies. The KPIs are risky customers, retention rate, monthly recurring revenue MRR, churn risk by location and income, etc. This KPI Metrics Dashboard To Measure Success Of Customer Churn Prevention Strategies Diagrams PDF is perfect for any presentation, be it in front of clients or colleagues. It is a versatile and stylish solution for organizing your meetings. The KPI Metrics Dashboard To Measure Success Of Customer Churn Prevention Strategies Diagrams PDF features a modern design for your presentation meetings. The adjustable and customizable slides provide unlimited possibilities for acing up your presentation. Slidegeeks has done all the homework before launching the product for you. So, do not wait, grab the presentation templates today


The following slide depicts a maintenance KPI dashboard to have useful insights for effective decision making. It includes key performance areas such as quarterly cost variance, scrap, quarterly run time variance analysis etc. Pitch your topic with ease and precision using this Quarterly Cost Variance Analysis With Maintenance Metrics Dashboard Information PDF. This layout presents information on Production, Budgeted Cost, Planned Run Time, Actual Run Time. It is also available for immediate download and adjustment. So, changes can be made in the color, design, graphics or any other component to create a unique layout.


The following slide highlights the maintenance KPIs to assess and gauge performance. It includes elements such as average downtime, average utilization, error wise downtime, daily average utilization, week wise average utilization etc. Showcasing this set of slides titled Maintenance Metrics Dashboard With Downtime And Utilization Pictures PDF. The topics addressed in these templates are Maintenance Metrics Dashboard, Downtime And Utilization. All the content presented in this PPT design is completely editable. Download it and make adjustments in color, background, font etc. as per your unique business setting.
This slide showcases dashboard for lead conversion metrics that can help organization to filter out total leads interested from the leads who have responded to the phone calls by organization. It also showcases key metrics such as leads busiest hours, leads busiest days, phone number types and lead types. Showcasing this set of slides titled Lead Tracking Metrics Dashboard With User Responses Diagrams PDF. The topics addressed in these templates are Busiest Hours Leads, Conversion Metrics, Lead Types. All the content presented in this PPT design is completely editable. Download it and make adjustments in color, background, font etc. as per your unique business setting.


The purpose of this slide is to highlight performance KPI dashboard used to monitor the cyber threat management. The metrics highlighted in the slide are risk score, compliance status, threat level, monitoring and operational status. Welcome to our selection of the Implementing Cybersecurity Awareness Program To Prevent Attacks KPI Metrics Dashboard To Effectively Track Inspiration PDF. These are designed to help you showcase your creativity and bring your sphere to life. Planning and Innovation are essential for any business that is just starting out. This collection contains the designs that you need for your everyday presentations. All of our PowerPoints are 100 percent editable, so you can customize them to suit your needs. This multi purpose template can be used in various situations. Grab these presentation templates today.
This slide covers the dashboard for analyzing blogging KPIs such as performance, published posts, views, new blog subscribers, top blog posts by pageviews, top blog posts by CTR, etc. Retrieve professionally designed Marketing Success Metrics Dashboard For Tracking Business Blog Kpis Brochure PDF to effectively convey your message and captivate your listeners. Save time by selecting pre-made slideshows that are appropriate for various topics, from business to educational purposes. These themes come in many different styles, from creative to corporate, and all of them are easily adjustable and can be edited quickly. Access them as PowerPoint templates or as Google Slides themes. You dont have to go on a hunt for the perfect presentation because Slidegeeks got you covered from everywhere.
This slide covers the KPI dashboard for analyzing SEO metrics such as authority score, organic traffic, organic keywords, paid keywords, ref. Domains, site audit, link-building tool, organic traffic, on-page SEO checker, backlink audit, etc. This Marketing Success Metrics KPI Dashboard For Tracking Seo Analytics Background PDF from Slidegeeks makes it easy to present information on your topic with precision. It provides customization options, so you can make changes to the colors, design, graphics, or any other component to create a unique layout. It is also available for immediate download, so you can begin using it right away. Slidegeeks has done good research to ensure that you have everything you need to make your presentation stand out. Make a name out there for a brilliant performance.
This slide covers the dashboard for analysing paid search metrics such as ad cost, clicks, impressions, click-through rate, cost per conversion, conversion rate, cost per click, etc. Here you can discover an assortment of the finest PowerPoint and Google Slides templates. With these templates, you can create presentations for a variety of purposes while simultaneously providing your audience with an eye-catching visual experience. Download Marketing Success Metrics KPI Dashboard For Tracking Paid Ad Campaign Microsoft PDF to deliver an impeccable presentation. These templates will make your job of preparing presentations much quicker, yet still, maintain a high level of quality. Slidegeeks has experienced researchers who prepare these templates and write high-quality content for you. Later on, you can personalize the content by editing the Marketing Success Metrics KPI Dashboard For Tracking Paid Ad Campaign Microsoft PDF.


The following slide outlines key performance indicator KPI dashboard which can be used to measure the success of product launch. The KPIs are total units, revenue, average selling price ASP, number of penetrated planned customers etc. Make sure to capture your audiences attention in your business displays with our gratis customizable KPI Metrics Dashboard To Analyze The Effectiveness Of New Introducing New Food Pictures PDF. These are great for business strategies, office conferences, capital raising or task suggestions. If you desire to acquire more customers for your tech business and ensure they stay satisfied, create your own sales presentation with these plain slides.


The following slide outlines a comprehensive KPI dashboard which can be used to analyze the performance of Facebook video campaign. It provides information about page video views, page video views organic etc. Formulating a presentation can take up a lot of effort and time, so the content and message should always be the primary focus. The visuals of the PowerPoint can enhance the presenters message, so our KPI Metrics Dashboard To Evaluate Facebook Video Campaign Performance Introduction PDF was created to help save time. Instead of worrying about the design, the presenter can concentrate on the message while our designers work on creating the ideal templates for whatever situation is needed. Slidegeeks has experts for everything from amazing designs to valuable content, we have put everything into KPI Metrics Dashboard To Evaluate Facebook Video Campaign Performance Introduction PDF.


Mentioned slide outlines a comprehensive KPI dashboard used to measure the call center performance. The dashboard monitors the status of key metrics such as call abandonment levels, current service level, average call length, total calls attended, calls waiting etc. Showcasing this set of slides titled Metrics Dashboard To Measure Call Center Success Themes PDF. The topics addressed in these templates are Center Success, Call Center Status, Call Monitor. All the content presented in this PPT design is completely editable. Download it and make adjustments in color, background, font etc. as per your unique business setting.
SHOW
- 60
- 120
- 180
DISPLAYING: 60 of 433 Item(s)
Page