 AI PPT Maker
 Templates
 PPT Bundles
 Design Services
 Business PPTs
 Business Plan
 Management
 Strategy
 Introduction PPT
 Roadmap
 Self Introduction
 Timelines
 Process
 Marketing
 Agenda
 Technology
 Medical
 Startup Business Plan
 Cyber Security
 Dashboards
 SWOT
SWOT Proposals
 Education
 Pitch Deck
 Digital Marketing
 KPIs
KPIs Project Management
 Product Management
 Artificial Intelligence
 Target Market
 Communication
 Supply Chain
 Google Slides
 Research Services
 One Pagers
 All Categories
Indicator Dashboard PowerPoint Presentation Templates and Google Slides
SHOW
- 60
- 120
- 180
DISPLAYING: 60 of 74 Item(s)
Page


Boost your confidence and team morale with this well-structured Risk Key Performance Indicator Dashboard Ppt PowerPoint Presentation Complete Deck With Slides. This prefabricated set gives a voice to your presentation because of its well-researched content and graphics. Our experts have added all the components very carefully, thus helping you deliver great presentations with a single click. Not only that, it contains a set of sixteen slides that are designed using the right visuals, graphics, etc. Various topics can be discussed, and effective brainstorming sessions can be conducted using the wide variety of slides added in this complete deck. Apart from this, our PPT design contains clear instructions to help you restructure your presentations and create multiple variations. The color, format, design anything can be modified as deemed fit by the user. Not only this, it is available for immediate download. So, grab it now.


Share a great deal of information on the topic by deploying this Quality Assurance Indicator Dashboard Ppt PowerPoint Presentation Complete Deck With Slides. Support your ideas and thought process with this prefabricated set. It includes a set of Fifteen slides, all fully modifiable and editable. Each slide can be restructured and induced with the information and content of your choice. You can add or remove large content boxes as well, to make this PPT slideshow more personalized. Its high-quality graphics and visuals help in presenting a well-coordinated pitch. This PPT template is also a resourceful tool to take visual cues from and implement the best ideas to help your business grow and expand. The main attraction of this well-formulated deck is that everything is editable, giving you the freedom to adjust it to your liking and choice. Changes can be made in the background and theme as well to deliver an outstanding pitch. Therefore, click on the download button now to gain full access to this multifunctional set.


This is a leading indicators dashboard diagram ppt sample. This is a five stage process. The stages in this process are customer satisfaction, leading indicators, average time to resolution, performance drivers, cost per resolution, productivity, employee satisfaction, proficiency, results, process, learning, alignment.


This slide covers dashboard to measure the performance of ad campaigns on LinkedIn platform. The purpose of this template is to provide the company an overview on the outcomes of running ad campaigns on LinkedIn. It includes performance based on impressions, CTR, engagement rates, CPC, CPM, etc. Find a pre designed and impeccable Ad Campaign Performance Indicators Tracking Dashboard Diagrams PDF. The templates can ace your presentation without additional effort. You can download these easy to edit presentation templates to make your presentation stand out from others. So, what are you waiting for Download the template from Slidegeeks today and give a unique touch to your presentation.


This slide showcases call center process measurements and key performance indicators so managers and teams can keep track of and improve performance . It includes received calls, calculating speed of answering calls , ended calls before starting conversations , average calls per minute etc. Showcasing this set of slides titled Call Center Process Key Performance Indicator Dashboard Mockup PDF. The topics addressed in these templates are Received Calls, Conversation, Abandon Rate. All the content presented in this PPT design is completely editable. Download it and make adjustments in color, background, font etc. as per your unique business setting.
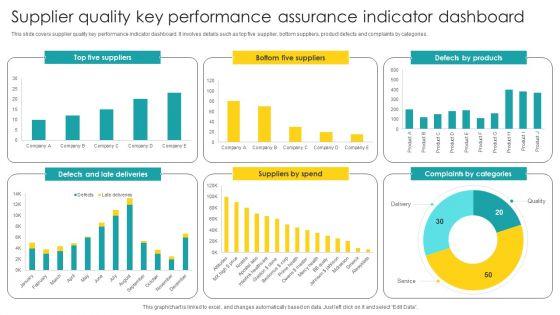
Showcasing this set of slides titled Supplier Quality Key Performance Assurance Indicator Dashboard Diagrams PDF. The topics addressed in these templates are Supplier Quality, Key Performance, Assurance Indicator. All the content presented in this PPT design is completely editable. Download it and make adjustments in color, background, font etc. as per your unique business setting.
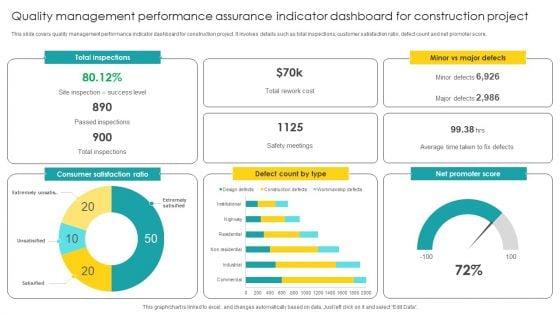

Pitch your topic with ease and precision using this Quality Management Performance Assurance Indicator Dashboard For Construction Project Pictures PDF. This layout presents information on Assurance Indicator, Dashboard For Construction Project. It is also available for immediate download and adjustment. So, changes can be made in the color, design, graphics or any other component to create a unique layout.


Showcasing this set of slides titled Quality Management Key Performance Assurance Indicator Dashboard For Service Sector Designs PDF. The topics addressed in these templates are Assurance Indicator, Dashboard For Service Sector. All the content presented in this PPT design is completely editable. Download it and make adjustments in color, background, font etc. as per your unique business setting.
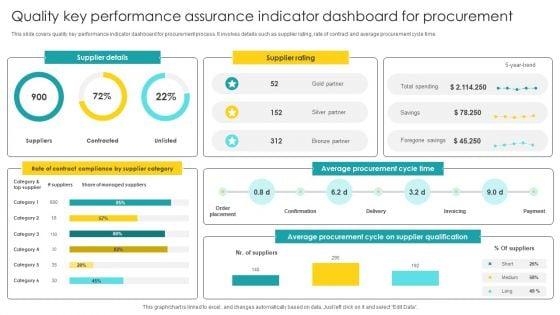

Pitch your topic with ease and precision using this Quality Key Performance Assurance Indicator Dashboard For Procurement Elements PDF. This layout presents information on Indicator Dashboard, Procurement. It is also available for immediate download and adjustment. So, changes can be made in the color, design, graphics or any other component to create a unique layout.
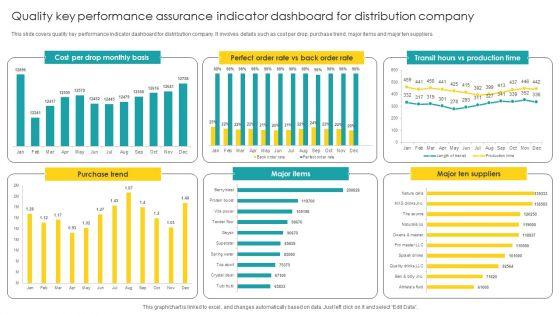

Showcasing this set of slides titled Quality Key Performance Assurance Indicator Dashboard For Distribution Company Mockup PDF. The topics addressed in these templates are Performance Assurance, Indicator Dashboard, Distribution Company. All the content presented in this PPT design is completely editable. Download it and make adjustments in color, background, font etc. as per your unique business setting.
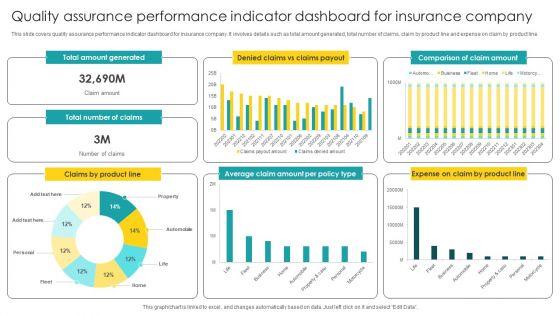

Pitch your topic with ease and precision using this Quality Assurance Performance Indicator Dashboard For Insurance Company Brochure PDF. This layout presents information on Performance Indicator, Dashboard For Insurance Company. It is also available for immediate download and adjustment. So, changes can be made in the color, design, graphics or any other component to create a unique layout.


Showcasing this set of slides titled Quality Assurance Key Performance Indicator Dashboard Structure PDF. The topics addressed in these templates are Key Performance, Indicator Dashboard. All the content presented in this PPT design is completely editable. Download it and make adjustments in color, background, font etc. as per your unique business setting.


Pitch your topic with ease and precision using this Project Quality Management Key Performance Assurance Indicator Dashboard Guidelines PDF. This layout presents information on Management Key, Performance Assurance, Indicator Dashboard. It is also available for immediate download and adjustment. So, changes can be made in the color, design, graphics or any other component to create a unique layout.
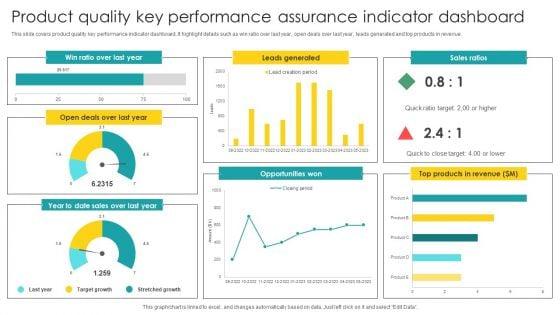
Showcasing this set of slides titled Product Quality Key Performance Assurance Indicator Dashboard Graphics PDF. The topics addressed in these templates are Key Performance, Assurance Indicator, Dashboard. All the content presented in this PPT design is completely editable. Download it and make adjustments in color, background, font etc. as per your unique business setting.


Pitch your topic with ease and precision using this Manufacturing Quality Management Key Performance Assurance Indicator Dashboard Microsoft PDF. This layout presents information on Quality Management, Key Performance Assurance. It is also available for immediate download and adjustment. So, changes can be made in the color, design, graphics or any other component to create a unique layout.


Showcasing this set of slides titled HR Training Quality Performance Management Assurance Indicator Dashboard Structure PDF. The topics addressed in these templates are Performance Management, Assurance Indicator Dashboard. All the content presented in this PPT design is completely editable. Download it and make adjustments in color, background, font etc. as per your unique business setting.
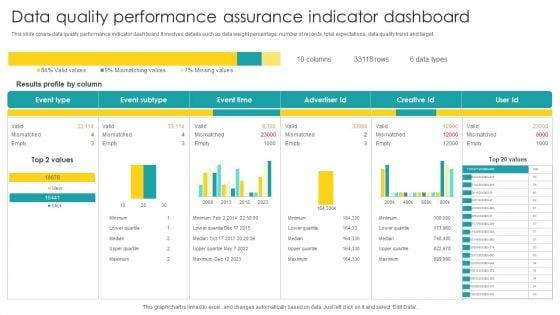
Pitch your topic with ease and precision using this Data Quality Performance Assurance Indicator Dashboard Diagrams PDF. This layout presents information on Data Quality Performance, Assurance Indicator Dashboard. It is also available for immediate download and adjustment. So, changes can be made in the color, design, graphics or any other component to create a unique layout.
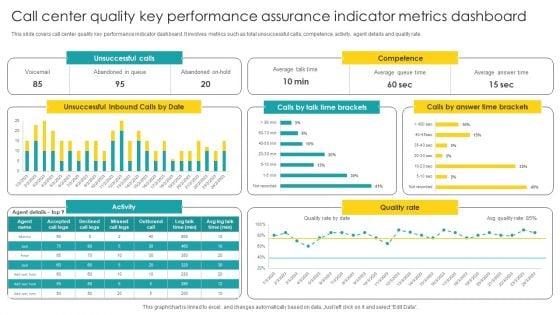
Showcasing this set of slides titled Call Center Quality Key Performance Assurance Indicator Metrics Dashboard Portrait PDF. The topics addressed in these templates are Key Performance, Assurance Indicator, Metrics Dashboard. All the content presented in this PPT design is completely editable. Download it and make adjustments in color, background, font etc. as per your unique business setting.


The following slide highlights the safety key performance indicator dashboard with mitigation strategy. It showcases incident handling team, safety accident avoided, mitigation strategy, total and critical incident, event cost and case per employee. Showcasing this set of slides titled Risk Key Performance Indicator Dashboard With Mitigation Strategy Ppt Inspiration Design Templates PDF. The topics addressed in these templates are Incident Handling Team, Safety Incident Avoided, Safety Incident. All the content presented in this PPT design is completely editable. Download it and make adjustments in color, background, font etc. as per your unique business setting.


The following slide highlights the safety key performance indicator dashboard with injury cost. It showcases recordable incident rate, serious injuries, injury cost, reporting culture trend, fleet accidents, project safety, safety training completion and safety incidents. Pitch your topic with ease and precision using this Risk Key Performance Indicator Dashboard With Injury Cost Ppt Summary Brochure PDF. This layout presents information on Recordable Incident Rate, Reporting Culture Trend, Project Safety. It is also available for immediate download and adjustment. So, changes can be made in the color, design, graphics or any other component to create a unique layout.


The slide highlights the safety key performance dashboard with hazard ratings. It showcases key performance indicator, open hazards by rating, categorization, types, status, related risk and hazards by department and rating. Showcasing this set of slides titled Risk Key Performance Indicator Dashboard With Hazard Ratings Ppt Layouts Slideshow PDF. The topics addressed in these templates are Key Performance Indicator, Open Hazards, Hazards By Status. All the content presented in this PPT design is completely editable. Download it and make adjustments in color, background, font etc. as per your unique business setting.


The following slide highlights the safety key performance indicator dashboard for manufacturing company. It showcases safety incident per employee, total number of cases, safety events avoided, accumulated total and safety incidents. Pitch your topic with ease and precision using this Risk Key Performance Indicator Dashboard For Manufacturing Company Ppt Gallery Graphics Design PDF. This layout presents information on Safety Incidents, Safety Incident Avoided, Safety Incident Accumulated. It is also available for immediate download and adjustment. So, changes can be made in the color, design, graphics or any other component to create a unique layout.


The following slide highlights the risk awareness and safety key performance indicator dashboard illustrating risk awareness, clear leadership, risk mitigation preparedness, risk incidents last month, safety incidents last months, inspection plan adherence, risk and safety quality training, trained people last month, monitoring, safety tools change on and risk awareness. Showcasing this set of slides titled Risk Awareness And Risk Key Performance Indicator Dashboard Ppt Inspiration Ideas PDF. The topics addressed in these templates are Safety Incident Avoided, Safety Incidents, Safety Incident, Accumulated Total. All the content presented in this PPT design is completely editable. Download it and make adjustments in color, background, font etc. as per your unique business setting.


The following slide highlights the patient health and safety key performance indicator dashboard illustrating admission by department, admission by cost, patient satisfaction, total patients, operations cost, patient density, total staff, waiting time, treatment satisfaction and treatment confidence. Pitch your topic with ease and precision using this Patient Health And Risk Key Performance Indicator Dashboard Ppt Infographic Template Summary PDF. This layout presents information on Admission By Department, Admission Vs Cost, Patient Satisfaction. It is also available for immediate download and adjustment. So, changes can be made in the color, design, graphics or any other component to create a unique layout.


The following slide highlights the incident and safety key performance indicator dashboard. It shows total safety, critical safety, avoided safety incidents. It also depicts cost, severity, type and impact of safety incidents. Showcasing this set of slides titled Incident And Risk Key Performance Indicator Dashboard Ppt Gallery Mockup PDF. The topics addressed in these templates are Safety Incident Severity, Safety Incident Type, Safety Incident Impact. All the content presented in this PPT design is completely editable. Download it and make adjustments in color, background, font etc. as per your unique business setting.


The slide highlights the health and safety performance kpi dashboard illustrating key headings which includes kpi, period, root causes, result matrix and at risk employment. Where kpi depicts lost time incidents, medically treated, with injuries, injured people and total incidents. Showcasing this set of slides titled Health And Risk Key Performance Indicator Dashboard Ppt Layouts Graphics Design PDF. The topics addressed in these templates are Root Causes, Result Matrix, At Risk Employment. All the content presented in this PPT design is completely editable. Download it and make adjustments in color, background, font etc. as per your unique business setting.


The following slide highlights the employee safety key performance indicator dashboard with case incident rate illustrating total case occurrence rate, last reported case, days without reported, causing items, corrective actions, incident pyramid, incident by month and major causes. Pitch your topic with ease and precision using this Employee Risk Key Performance Indicator Dashboard With Case Incident Rate Ppt Professional Information PDF. This layout presents information on Total Case, Incident Rate, Last Incident Reported, Incident Causing Items. It is also available for immediate download and adjustment. So, changes can be made in the color, design, graphics or any other component to create a unique layout.


The slide highlights the comparative health and safety key performance indicator dashboard. It shows current year and previous events, safety incident classification, safety cases by place, map and safety consequence. Showcasing this set of slides titled Comparative Health And Risk Key Performance Indicator Dashboard Ppt Portfolio Slide PDF. The topics addressed in these templates are Safety Consequence, Safety Incidents Classification, Map. All the content presented in this PPT design is completely editable. Download it and make adjustments in color, background, font etc. as per your unique business setting.
This slide shows dashboard of finance KPIs . It covers working capital, cash conversion cycle, vendor payment error rate ,current assets and liabilities. Showcasing this set of slides titled Company Financial Performance Indicators Dashboard With Working Capital And Cash Conversion Icons PDF. The topics addressed in these templates are Current Working Capital, Current Liabilities, Working Capital. All the content presented in this PPT design is completely editable. Download it and make adjustments in color, background, font etc. as per your unique business setting.


This graph or chart is linked to excel, and changes automatically based on data. Just left click on it and select Edit Data. Pitch your topic with ease and precision using this Company Financial Performance Indicators Dashboard With Liquidity And Turnover Ratios Formats PDF. This layout presents information on Cash Balance, Days Inventory Outstanding, Days Payable Outstanding. It is also available for immediate download and adjustment. So, changes can be made in the color, design, graphics or any other component to create a unique layout.


This slide shows financial performance indicator dashboard covering net profit and net sales, profitability indicator ratios, cogs and net profit by region or channel. Deliver and pitch your topic in the best possible manner with this Financial Performance Indicator Dashboard Company Performance Evaluation Using KPI Structure PDF. Use them to share invaluable insights on Financial Performance, Indicator Dashboard, Profitability Indicator and impress your audience. This template can be altered and modified as per your expectations. So, grab it now.


This slide covers cyber security health status dashboard . It also includes audit and compliance, controls health, project status, incident response process, vulnerability patching schedule, investigation process and training compliance. Pitch your topic with ease and precision using this Cyber Security Key Performance Indicators Metrics Dashboard Mockup PDF. This layout presents information on Cyber Security, Vulnerability Patching Schedule, Compliance Investigation Process. It is also available for immediate download and adjustment. So, changes can be made in the color, design, graphics or any other component to create a unique layout.


This slide shows financial performance indicator dashboard covering net profit and net sales, profitability indicator ratios, cogs and net profit by region or channel. Deliver and pitch your topic in the best possible manner with this Kpis For Evaluating Business Sustainability Financial Performance Indicator Dashboard Demonstration PDF. Use them to share invaluable insights on Net Profit, Net Profit Margin, Profitability Indicator Ratios and impress your audience. This template can be altered and modified as per your expectations. So, grab it now.


This slide shows financial performance indicator dashboard covering net profit and net sales, profitability indicator ratios, cogs and net profit by region or channel.Deliver an awe inspiring pitch with this creative Enterprise Sustainability Performance Metrics Financial Performance Indicator Dashboard Themes PDF bundle. Topics like Profitability Indicator, Sold Breakdown, Target Actual can be discussed with this completely editable template. It is available for immediate download depending on the needs and requirements of the user.


This slide shows financial performance indicator dashboard covering net profit and net sales, profitability indicator ratios, cogs and net profit by region or channel. Deliver an awe inspiring pitch with this creative Metrics To Measure Business Performance Financial Performance Indicator Dashboard Pictures PDF bundle. Topics like Net Profit, Net Sales, Cost Goods, Sold Breakdown can be discussed with this completely editable template. It is available for immediate download depending on the needs and requirements of the user.


The following slide depicts the key areas in Marketing Strategy for Shipping Business to monitor and optimize supply chain processes. It includes elements such as fleet and shipment status, country wise revenue, location wise delivery, average shipment time etc.Pitch your topic with ease and precision using this Marketing Strategy For Shipping Business Key Performance Indicator Dashboard Graphics PDF. This layout presents information on Shipment Status, Average Shipment, Wise Revenue. It is also available for immediate download and adjustment. So, changes can be made in the color, design, graphics or any other component to create a unique layout.
Showcasing this set of slides titled Employee Key Performance Indicators Dashboard Icon Designs PDF The topics addressed in these templates are Employee Key, Performance Indicators, Dashboard Icon All the content presented in this PPT design is completely editable. Download it and make adjustments in color, background, font etc. as per your unique business setting.


The following slide highlights the staff turnover key performance Indicators dashboard illustrating employee turn over, turn over rate, average tenure, turnover per quarter, turnover per department, turnover type, turnover time period, turnover per position and turnover reasons Deliver and pitch your topic in the best possible manner with this Staff Turnover Key Performance Indicators Dashboard Sample PDF Use them to share invaluable insights on Management Goals, Subjective Appraisal, Product Defects and impress your audience. This template can be altered and modified as per your expectations. So, grab it now.


This slide illustrates graphical representation of risk key performance indicators. It includes third party vendors trust score, impact score and risk score. Pitch your topic with ease and precision using this Third Party Vendors Risk Metrics Performance Indicators Dashboard Topics PDF. This layout presents information on Third Party Vendors Risk Metrics Performance Indicators Dashboard. It is also available for immediate download and adjustment. So, changes can be made in the color, design, graphics or any other component to create a unique layout.
Persuade your audience using this Icon For Risk Metrics Performance Indicators Dashboard Designs PDF. This PPT design covers four stages, thus making it a great tool to use. It also caters to a variety of topics including Icon For Risk Metrics Performance Indicators Dashboard. Download this PPT design now to present a convincing pitch that not only emphasizes the topic but also showcases your presentation skills.


This slide showcases employee proficiency management with progress indicators dashboard. It provides information about skill statistics, skill bar analysis, training effectiveness survey, etc. Showcasing this set of slides titled employee competency management with progress indicators dashboard graphics pdf. The topics addressed in these templates are google analytics, social media, survey. All the content presented in this PPT design is completely editable. Download it and make adjustments in color, background, font etc. as per your unique business setting.


This slide shows financial performance indicator dashboard covering net profit and net sales, profitability indicator ratios, cogs and net profit by region or channel. Deliver an awe inspiring pitch with this creative sustainability calculation with kpi financial performance indicator dashboard infographics pdf bundle. Topics like net profit margin, net profit and net sales, profitability indicator ratios, sold breakdown can be discussed with this completely editable template. It is available for immediate download depending on the needs and requirements of the user.


Deliver and pitch your topic in the best possible manner with this strategic action plan for business organization key success indicators dashboard ideas pdf. Use them to share invaluable insights on key success indicators dashboard and impress your audience. This template can be altered and modified as per your expectations. So, grab it now.
SHOW
- 60
- 120
- 180
DISPLAYING: 60 of 74 Item(s)
Page