 AI PPT Maker
 Templates
 PPT Bundles
 Design Services
 Business PPTs
 Business Plan
 Management
 Strategy
 Introduction PPT
 Roadmap
 Self Introduction
 Timelines
 Process
 Marketing
 Agenda
 Technology
 Medical
 Startup Business Plan
 Cyber Security
 Dashboards
 SWOT
SWOT Proposals
 Education
 Pitch Deck
 Digital Marketing
 KPIs
KPIs Project Management
 Product Management
 Artificial Intelligence
 Target Market
 Communication
 Supply Chain
 Google Slides
 Research Services
 One Pagers
 All Categories
Dashboard Infographic PowerPoint Presentation Templates and Google Slides
SHOW
- 60
- 120
- 180
DISPLAYING: 60 of 143 Item(s)
Page


If designing a presentation takes a lot of your time and resources and you are looking for a better alternative, then this Survey Response Results KPI Dashboard Infographic Ppt PowerPoint Presentation Complete Deck With Slides is the right fit for you. This is a prefabricated set that can help you deliver a great presentation on the topic. All the twelv slides included in this sample template can be used to present a birds-eye view of the topic. These slides are also fully editable, giving you enough freedom to add specific details to make this layout more suited to your business setting. Apart from the content, all other elements like color, design, theme are also replaceable and editable. This helps in designing a variety of presentations with a single layout. Not only this, you can use this PPT design in formats like PDF, PNG, and JPG once downloaded. Therefore, without any further ado, download and utilize this sample presentation as per your liking.


This template covers the details of price optimization which focuses on number of visitors, customers, revenues, performance by devices, etc. From laying roadmaps to briefing everything in detail, our templates are perfect for you. You can set the stage with your presentation slides. All you have to do is download these easy to edit and customizable templates. Optimizing Smart Pricing Tactics To Improve Sales Price Optimization Dashboard Infographics PDF will help you deliver an outstanding performance that everyone would remember and praise you for. Do download this presentation today.


This slide showcases call center action plan dashboard which highlights first call resolution, unresolved calls, customers call report, response time by weekday and average answer time. Are you in need of a template that can accommodate all of your creative concepts This one is crafted professionally and can be altered to fit any style. Use it with Google Slides or PowerPoint. Include striking photographs, symbols, depictions, and other visuals. Fill, move around, or remove text boxes as desired. Test out color palettes and font mixtures. Edit and save your work, or work with colleagues. Download Comprehensive Guide For Enhancing Performance Of Customer Service Center Call Center Action Plan Dashboard Infographics PDF and observe how to make your presentation outstanding. Give an impeccable presentation to your group and make your presentation unforgettable.


The following slide display recurring revenue generated over the year, the following dashboard displays MRR, churn rate net recurring revenue and growth rate. Slidegeeks is one of the best resources for PowerPoint templates. You can download easily and regulate Periodic Revenue Model Recurring Revenue Dashboard Infographics PDF for your personal presentations from our wonderful collection. A few clicks is all it takes to discover and get the most relevant and appropriate templates. Use our Templates to add a unique zing and appeal to your presentation and meetings. All the slides are easy to edit and you can use them even for advertisement purposes.


This slide showcases KPI dashboard which can help sales team managers display and review performance rankings. It provides details about weekly sales score, target percentage, total target, sales team members, etc. Unleash your creativity with our How Leaders Can Improve Team Effectiveness Sales Team Performance Management KPI Dashboard Infographics PDF single-slide PPT template. Whether you are a seasoned presenter or a newbie, our editable and visually-stunning template will make your presentations shine. This template is versatile and easy to use. Make your presentations unforgettable with our premium template and leave a lasting impression on your audience.


Mentioned slide portrays customer service measurement KPI dashboard that includes metrics namely request volume vs. service level, customer satisfaction, customer retention, costs per support and average time to solve issue. If your project calls for a presentation, then Slidegeeks is your go-to partner because we have professionally designed, easy-to-edit templates that are perfect for any presentation. After downloading, you can easily edit Customer Service Measurement KPI Dashboard Ppt Infographics Themes PDF and make the changes accordingly. You can rearrange slides or fill them with different images. Check out all the handy templates
This slide provides information regarding product branding performance tracking dashboard in terms of revenues, new customers, customer satisfaction rate. Make sure to capture your audiences attention in your business displays with our gratis customizable Product Branding To Enhance Product Sales Performance Tracking Dashboard Infographics PDF. These are great for business strategies, office conferences, capital raising or task suggestions. If you desire to acquire more customers for your tech business and ensure they stay satisfied, create your own sales presentation with these plain slides.


The following slide depicts real time content marketing KPI dashboard to monitor traffic flow and manage promotional efforts. It includes elements such as visitors by channel, conversion rate, search, direct, sessions, average time engaged etc. The Real Time Content Marketing Result Dashboard Ppt Infographic Template Example PDF is a compilation of the most recent design trends as a series of slides. It is suitable for any subject or industry presentation, containing attractive visuals and photo spots for businesses to clearly express their messages. This template contains a variety of slides for the user to input data, such as structures to contrast two elements, bullet points, and slides for written information. Slidegeeks is prepared to create an impression.


This slide depicts the dashboard for sales performance after the implementation of visualization research based on revenue, quantity, regional sales. Crafting an eye-catching presentation has never been more straightforward. Let your presentation shine with this tasteful yet straightforward Branches For Visualization Research And Development Sales Performance Dashboard After Infographics PDF template. It offers a minimalistic and classy look that is great for making a statement. The colors have been employed intelligently to add a bit of playfulness while still remaining professional. Construct the ideal Branches For Visualization Research And Development Sales Performance Dashboard After Infographics PDF that effortlessly grabs the attention of your audience Begin now and be certain to wow your customers.


This slide defines the dashboard analyzing the social media demographics. It includes information related to the trends, followers and impressions. Pitch your topic with ease and precision using this Social Media Demographic Data Analysis Dashboard Infographics PDF. This layout presents information on Audience Demographics, Group Trends, Impressions Demographics It is also available for immediate download and adjustment. So, changes can be made in the color, design, graphics or any other component to create a unique layout.


This slide demonstrates the dashboard for monitoring the glucose level in blood based on insulin onboard, carb intake, physical activity. Are you in need of a template that can accommodate all of your creative concepts This one is crafted professionally and can be altered to fit any style. Use it with Google Slides or PowerPoint. Include striking photographs, symbols, depictions, and other visuals. Fill, move around, or remove text boxes as desired. Test out color palettes and font mixtures. Edit and save your work, or work with colleagues. Download Biochip Technology Blood Glucose Monitoring Dashboard Infographics PDF and observe how to make your presentation outstanding. Give an impeccable presentation to your group and make your presentation unforgettable.
This slide illustrates facts and data figures related to software project monitoring with DevOps. It includes lines of code, code elements, quality gates, rules, issues, etc. Showcasing this set of slides titled Continuous IT Project Tracking In Devops Dashboard Infographics PDF. The topics addressed in these templates are Most Recent, Baseline Build, Code Elements. All the content presented in this PPT design is completely editable. Download it and make adjustments in color, background, font etc. as per your unique business setting.


This slide represents the dashboard showing details related to customer relationship management software. It includes details related to outbound sales, contracts closed, average contract value etc. Present like a pro with Strategic Plan For Enterprise Customer Relationship Management Software KPI Dashboard Infographics PDF Create beautiful presentations together with your team, using our easy-to-use presentation slides. Share your ideas in real-time and make changes on the fly by downloading our templates. So whether youre in the office, on the go, or in a remote location, you can stay in sync with your team and present your ideas with confidence. With Slidegeeks presentation got a whole lot easier. Grab these presentations today.


This slide defines the dashboard for analyzing the website SEO audit reports. It includes information related to the site health, errors, warnings, reports, etc. Showcasing this set of slides titled Website Search Engine Optimization Summary Analysis Dashboard Infographics PDF. The topics addressed in these templates are Crawled Pages, Thematic Reports, Site Health, Warnings. All the content presented in this PPT design is completely editable. Download it and make adjustments in color, background, font etc. as per your unique business setting.


The following slide displays key parameters to map involvement of stakeholders in the business by analyzing them on the basis of influence, interest and impact to monitor and improve overall communication strategies of organization. Pitch your topic with ease and precision using this Stakeholders Management Strategy With Engagement Dashboard Infographics PDF. This layout presents information on Influence, Interest, Impact. It is also available for immediate download and adjustment. So, changes can be made in the color, design, graphics or any other component to create a unique layout.


This slide represents dashboard representing details related to management of strategic risks in the organization. It includes details related to risk rating breakdown, risk heat map, top 5 vulnerabilities etc. Do you have an important presentation coming up Are you looking for something that will make your presentation stand out from the rest Look no further than Enterprise Risk Management Enterprise Cyber Risk Management Dashboard Infographics PDF. With our professional designs, you can trust that your presentation will pop and make delivering it a smooth process. And with Slidegeeks, you can trust that your presentation will be unique and memorable. So why wait Grab Enterprise Risk Management Enterprise Cyber Risk Management Dashboard Infographics PDF today and make your presentation stand out from the rest.


Pitch your topic with ease and precision using this Company Sales By Area Dashboard Infographics PDF. This layout presents information on Total Sales, Sales Locations, Highest Market. It is also available for immediate download and adjustment. So, changes can be made in the color, design, graphics or any other component to create a unique layout.


Pitch your topic with ease and precision using this Quarterly Business Performance Review With KPI Dashboard Infographics PDF. This layout presents information on Sales And Revenue Comparison, Top Selling Product. It is also available for immediate download and adjustment. So, changes can be made in the color, design, graphics or any other component to create a unique layout.


This slide shows the dashboard representing the operational analysis related to change management of an IT project. It shows details related to top requesting groups, outstanding change requests, outstanding age breakdown etc.Pitch your topic with ease and precision using this IT Project Change Management Operations Analysis Dashboard Infographics PDF. This layout presents information on Outstanding Requests, Outstanding Breakdown, Outstanding Changes. It is also available for immediate download and adjustment. So, changes can be made in the color, design, graphics or any other component to create a unique layout.


The following slide showcases IT problem management dashboard to minimize impact of issues on organization operations. It includes support requests, average hour spent to resolve issue, problem type and category. Showcasing this set of slides titled Information Technology Incident Management Dashboard Infographics PDF. The topics addressed in these templates are Avg Mean Time, Resolve The Issue, Issue Type. All the content presented in this PPT design is completely editable. Download it and make adjustments in color, background, font etc. as per your unique business setting.


This slide represents key metrics dashboard to track and analyze performance of product information management of the enterprise. It includes details related to status of various enterprise products. Here you can discover an assortment of the finest PowerPoint and Google Slides templates. With these templates, you can create presentations for a variety of purposes while simultaneously providing your audience with an eye catching visual experience. Download PIM Software Deployment To Enhance Conversion Rates Enterprise Product Information Management KPI Dashboard Infographics PDF to deliver an impeccable presentation. These templates will make your job of preparing presentations much quicker, yet still, maintain a high level of quality. Slidegeeks has experienced researchers who prepare these templates and write high quality content for you. Later on, you can personalize the content by editing the PIM Software Deployment To Enhance Conversion Rates Enterprise Product Information Management KPI Dashboard Infographics PDF.


This slide represents the dashboard showing the key performance measures to analyze and monitor the customer acquisition and conversion rate. It includes details related to KPIs such as direct traffic, sessions by source, social networks, paid keywords etc. Presenting this PowerPoint presentation, titled Analyzing And Deploying Effective CMS Customer Acquisition And Conversion Key Metrics Dashboard Infographics PDF, with topics curated by our researchers after extensive research. This editable presentation is available for immediate download and provides attractive features when used. Download now and captivate your audience. Presenting this Analyzing And Deploying Effective CMS Customer Acquisition And Conversion Key Metrics Dashboard Infographics PDF. Our researchers have carefully researched and created these slides with all aspects taken into consideration. This is a completely customizable Analyzing And Deploying Effective CMS Customer Acquisition And Conversion Key Metrics Dashboard Infographics PDF that is available for immediate downloading. Download now and make an impact on your audience. Highlight the attractive features available with our PPTs.


Following slide illustrates KPI dashboard that can be used to track the awareness level of a specific brand. KPIs covered in the slide are traffic, attention, authority, inbound channel performance etc.From laying roadmaps to briefing everything in detail, our templates are perfect for you. You can set the stage with your presentation slides. All you have to do is download these easy-to-edit and customizable templates. Guide To Develop And Estimate Brand Value Brand Awareness Measuring Kpi Dashboard Infographics PDF will help you deliver an outstanding performance that everyone would remember and praise you for. Do download this presentation today.


This slide represents the product advertising campaign report. It covers advertisement costs, conversions, clicks, cost per conversion, impressions with clicks, and conversions by the campaign. Showcasing this set of slides titled Product Advertisement Marketing Campaign Dashboard Ppt Infographic Template Show PDF. The topics addressed in these templates are Ads Clicks, Ads Conversions, Conversion Through Advertisement, Advertisement Cost. All the content presented in this PPT design is completely editable. Download it and make adjustments in color, background, font etc. as per your unique business setting.


This slide illustrates graphical representation of data that helps the insurer company manages the car insurance policy claims. It includes no. of claims, percentage of claims, claims by usage, claims by type of vehicle etc. Pitch your topic with ease and precision using this Auto Insurance Policies Claims Management Dashboard Infographics PDF. This layout presents information on Percentage Claims, Claims Usage, Claims Type Vehicle. It is also available for immediate download and adjustment. So, changes can be made in the color, design, graphics or any other component to create a unique layout.
This slide provides information regarding ongoing construction project progress tracking dashboard along with details such as project status, project type, project progress, etc. This modern and well arranged Construction Project Instructions Playbook Ongoing Construction Project Progress Tracking Dashboard Infographics PDF provides lots of creative possibilities. It is very simple to customize and edit with the Powerpoint Software. Just drag and drop your pictures into the shapes. All facets of this template can be edited with Powerpoint no extra software is necessary. Add your own material, put your images in the places assigned for them, adjust the colors, and then you can show your slides to the world, with an animated slide included.


This slide provides information regarding product launch team performance with key result area scores for idea generation, engineering and design and key result areas performance. Do you know about Slidesgeeks Commodity Launch Administration Playbook Product Launch Team Performance Dashboard Infographics PDF These are perfect for delivering any kind od presentation. Using it, create PowerPoint presentations that communicate your ideas and engage audiences. Save time and effort by using our pre-designed presentation templates that are perfect for a wide range of topic. Our vast selection of designs covers a range of styles, from creative to business, and are all highly customizable and easy to edit. Download as a PowerPoint template or use them as Google Slides themes.


This slide provides information regarding reputation management to monitor brands status in terms of brand review summary, listing score, competition, listing accuracy, etc. Find highly impressive Developing Brand Awareness To Gain Customer Attention Reputation Management Dashboard Infographics PDF on Slidegeeks to deliver a meaningful presentation. You can save an ample amount of time using these presentation templates. No need to worry to prepare everything from scratch because Slidegeeks experts have already done a huge research and work for you. You need to download Developing Brand Awareness To Gain Customer Attention Reputation Management Dashboard Infographics PDF for your upcoming presentation. All the presentation templates are 100 Precent editable and you can change the color and personalize the content accordingly. Download now.


The following slide highlights the revenue and margin growth analytics dashboard illustrating key headings which includes revenue, gross margin, gross margin growth, monthly revenue, monthly gross margin, monthly gross margin growth, gross margin by supplier and gross margin by channel. Pitch your topic with ease and precision using this Revenue And Growth Analysis Analytics Dashboard Ppt Infographic Template Brochure PDF. This layout presents information on Monthly Revenue, Monthly Gross Margin, Gross Margin Growth. It is also available for immediate download and adjustment. So, changes can be made in the color, design, graphics or any other component to create a unique layout.


This slide shows the dashboard for forecasting the sales of an automobile company for the current month. It represents details related to revenue by pipeline, new deals, sales forecast, revenue goal attainment by owner for the current month and pipeline coverage by next month. Showcasing this set of slides titled Automobile Company Actual And Forecasted Monthly Sales Dashboard Ppt Infographic Template Aids PDF. The topics addressed in these templates are Forecast Month, Revenue Goal Attainment, Revenue Goal Attainment. All the content presented in this PPT design is completely editable. Download it and make adjustments in color, background, font etc. as per your unique business setting.


Purpose of the following slide is to show key metrics that can help the organization to track their account based marketing efforts, it highlights essential KPIs such as CTR, session by account. Boost your pitch with our creative Account Based Marketing Customer Engagement Dashboard Infographics PDF. Deliver an awe inspiring pitch that will mesmerize everyone. Using these presentation templates you will surely catch everyones attention. You can browse the ppts collection on our website. We have researchers who are experts at creating the right content for the templates. So you do not have to invest time in any additional work. Just grab the template now and use them.


The following slide highlights the patient health and safety key performance indicator dashboard illustrating admission by department, admission by cost, patient satisfaction, total patients, operations cost, patient density, total staff, waiting time, treatment satisfaction and treatment confidence. Pitch your topic with ease and precision using this Patient Health And Risk Key Performance Indicator Dashboard Ppt Infographic Template Summary PDF. This layout presents information on Admission By Department, Admission Vs Cost, Patient Satisfaction. It is also available for immediate download and adjustment. So, changes can be made in the color, design, graphics or any other component to create a unique layout.


The following slide depicts the KPAs of software release management to analyze and monitor progress. It includes KPIs such as number of projects, accomplishment rate, task and bug fixation status, planned vs actual hours etc. Showcasing this set of slides titled Release Management Process Plan With KPI Dashboard Ppt Infographic Template Structure PDF. The topics addressed in these templates are Number Of Projects, Total Resources, Tasks Accomplishment Rate. All the content presented in this PPT design is completely editable. Download it and make adjustments in color, background, font etc. as per your unique business setting.


This slide provides information regarding IT spending management dashboard for tracking parameters such as asset controller, cost by service, potential savings, etc. Deliver and pitch your topic in the best possible manner with this CIO For IT Cost Optimization Techniques Determine IT Spending Management Dashboard Infographics PDF. Use them to share invaluable insights on Cost Entity Summary, Potential Savings, Cost By Service and impress your audience. This template can be altered and modified as per your expectations. So, grab it now.


Mentioned slide displays vendor compliance KPI dashboard. KPIs covered are top supplier by partner status, average procurement cycle time and average procurement cycle. Deliver and pitch your topic in the best possible manner with this Real Estate Developers Funding Alternatives Vendor Compliance Kpi Dashboard Infographics PDF. Use them to share invaluable insights on Average Procurement Cycle, Supplier Classification and impress your audience. This template can be altered and modified as per your expectations. So, grab it now.


This slide provides information regarding brand equity performance assessment dashboard that highlights customer lifecycle value, customer adoption rate, mentions, engagement, etc. Deliver and pitch your topic in the best possible manner with this Strategic Brand Management Brand Equity Performance Assessment Dashboard Infographics PDF. Use them to share invaluable insights on Market Share, Marketing Cost, Customer Lifetime Value, Customer Adoption Rate and impress your audience. This template can be altered and modified as per your expectations. So, grab it now.


Deliver an awe inspiring pitch with this creative Financial Report Of An IT Firm Companys Financials Dashboard Infographics PDF bundle. Topics like Operating Profit, Gross Profit, Income Statement can be discussed with this completely editable template. It is available for immediate download depending on the needs and requirements of the user.


This template covers Quality management system dashboard including KPIs such as outstanding actions, scheduled audits, item to attend to, and immediate actions required. Deliver an awe inspiring pitch with this creative ISO 9001 Quality Assurance Software Accreditation Business Quality Management And Audit Schedule Dashboard Infographics PDF bundle. Topics like Customer Satisfaction, Management Review Meeting, Business Continuity can be discussed with this completely editable template. It is available for immediate download depending on the needs and requirements of the user.
This is a Monthly Sales Report Performance Monitoring Dashboard Icon Infographics PDF template with various stages. Focus and dispense information on four stages using this creative set, that comes with editable features. It contains large content boxes to add your information on topics like Monthly Sales, Dashboard Icon, Report Performance. You can also showcase facts, figures, and other relevant content using this PPT layout. Grab it now.


The following slide displays the product performance dashboard as it highlights the top product by revenue, online vs. in store purchase, the sales by campaign Deliver an awe inspiring pitch with this creative New Commodity Market Viability Review Product Performance Dashboard Infographics PDF bundle. Topics like Online Purchase, Products Revenue, Sales Campaign can be discussed with this completely editable template. It is available for immediate download depending on the needs and requirements of the user.


This slide illustrates facts and figures related to project implementation status. It includes milestones, achievements, time spent, overall costs, team workload etc.Showcasing this set of slides titled Project Management And Execution Status Dashboard Infographics PDF. The topics addressed in these templates are Achievement, Team Workload, Overall Cost. All the content presented in this PPT design is completely editable. Download it and make adjustments in color, background, font etc. as per your unique business setting.


This slide represents the dashboard showing the performance of the service desk management team of the organization. It shows details related to benchmark achieved, customer satisfaction, contracts by type and manufacturer, incidents by category, computer by status, service level management etc. Showcasing this set of slides titled Organization IT Service Desk Administration Performance Dashboard Infographics PDF. The topics addressed in these templates are Service, Management, Manufacturer. All the content presented in this PPT design is completely editable. Download it and make adjustments in color, background, font etc. as per your unique business setting.


Deliver an awe inspiring pitch with this creative Accounting Statement Profit And Loss Analysis Dashboard Infographics PDF bundle. Topics like Accounting Statement Profit And Loss Analysis Dashboard can be discussed with this completely editable template. It is available for immediate download depending on the needs and requirements of the user.


This slide shows the dashboard related to project such as tasks, performance metrics and many more.Deliver an awe inspiring pitch with this creative Efficient Ways For Successful Project Administration Project And Tasks Implementation Dashboard Infographics PDF bundle. Topics like Project And Tasks Implementation Dashboard can be discussed with this completely editable template. It is available for immediate download depending on the needs and requirements of the user.


The following slide highlights the spas to assess customers changing needs and make strategies to improve. It consists of NPS, responses, weekly variations in needs, positive and negative feedback etc. Showcasing this set of slides titled customer need assessment kpi dashboard infographics pdf. The topics addressed in these templates are customer need assessment kpi dashboard. All the content presented in this PPT design is completely editable. Download it and make adjustments in color, background, font etc. as per your unique business setting.


This slide showcase total cost of ownership TCO dashboard for managing finances of software company. It provides information about consumers, distribution, last period, total spend, average per year, drivers, etc. Showcasing this set of slides titled financial management application total cost of ownership dashboard infographics pdf. The topics addressed in these templates are cost, application. All the content presented in this PPT design is completely editable. Download it and make adjustments in color, background, font etc. as per your unique business setting.


This slide provides information regarding B2B marketing activities dashboard catering KPIs related to campaign ROI, email, engagement, etc. Deliver and pitch your topic in the best possible manner with this b2b lead generation plan determine b2b marketing activities dashboard infographics pdf. Use them to share invaluable insights on determine b2b marketing activities dashboard and impress your audience. This template can be altered and modified as per your expectations. So, grab it now.


This slide shows the quality control dashboard to monitor the effectiveness of agile quality assurance model. It includes KPIs namely test execution summary, defect severity distribution, module-wise text execution and defect severity index Deliver an awe inspiring pitch with this creative agile methodology quality control quality control kpi dashboard ppt infographic template layout ideas pdf bundle. Topics like quality control kpi dashboard can be discussed with this completely editable template. It is available for immediate download depending on the needs and requirements of the user.


This slide covers the SIEM dashboard which focuses on security events, event categories, data sources, logger event, multiple events, etc. Deliver an awe inspiring pitch with this creative real time assessment of security threats security information and event management dashboard infographics pdf bundle. Topics like security information and event management dashboard can be discussed with this completely editable template. It is available for immediate download depending on the needs and requirements of the user.


This slide shows a dashboard which includes workload graph, team task tracking list, this week task priority, status and time tracking table. Showcasing this set of slides titled team task and time monitoring overview dashboard infographics pdf. The topics addressed in these templates are team task and time monitoring overview dashboard. All the content presented in this PPT design is completely editable. Download it and make adjustments in color, background, font etc. as per your unique business setting.


This slide is shows the project task management and time tracking dashboard which includes task progress Gantt chart, task overdue list, upcoming deadline list and workload column chart. Pitch your topic with ease and precision using this project task management and time monitoring dashboard infographics pdf. This layout presents information on planning, design, development. It is also available for immediate download and adjustment. So, changes can be made in the color, design, graphics or any other component to create a unique layout.


This slide highlights KPI dashboard exhibiting overall improvement in the financial performance of company as the consequences of program implementation. Deliver and pitch your topic in the best possible manner with this strategic procedure to improve employee efficiency company financial performance dashboard infographics pdf Use them to share invaluable insights on company financial performance dashboard and impress your audience. This template can be altered and modified as per your expectations. So, grab it now.
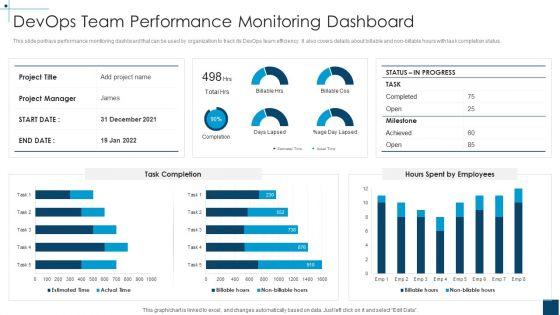
This slide portrays performance monitoring dashboard that can be used by organization to track its DevOps team efficiency. It also covers details about billable and non-billable hours with task completion status.Deliver and pitch your topic in the best possible manner with this devops principles for hybrid cloud it devops team performance monitoring dashboard infographics pdf Use them to share invaluable insights on devops team performance monitoring dashboard and impress your audience. This template can be altered and modified as per your expectations. So, grab it now.
This slide covers dashboard which helps the project managers to keep the track of all issues in detail. It also includes project name, department, project owner, detail of the issue, priority and status. Showcasing this set of slides titled project problem administration tracking dashboard infographics pdf. The topics addressed in these templates are project problem administration tracking dashboard. All the content presented in this PPT design is completely editable. Download it and make adjustments in color, background, font etc. as per your unique business setting.


This slide covers the customer relationship management dashboard which includes in progress and completed activities, lead target details, etc. Deliver and pitch your topic in the best possible manner with this customer relationship management dashboard ppt infographic template model pdf. Use them to share invaluable insights on customer relationship management dashboard and impress your audience. This template can be altered and modified as per your expectations. So, grab it now.


This slide shows financial performance indicator dashboard covering net profit and net sales, profitability indicator ratios, cogs and net profit by region or channel. Deliver an awe inspiring pitch with this creative sustainability calculation with kpi financial performance indicator dashboard infographics pdf bundle. Topics like net profit margin, net profit and net sales, profitability indicator ratios, sold breakdown can be discussed with this completely editable template. It is available for immediate download depending on the needs and requirements of the user.
SHOW
- 60
- 120
- 180
DISPLAYING: 60 of 143 Item(s)
Page