 AI PPT Maker
 Templates
 PPT Bundles
 Design Services
 Business PPTs
 Business Plan
 Management
 Strategy
 Introduction PPT
 Roadmap
 Self Introduction
 Timelines
 Process
 Marketing
 Agenda
 Technology
 Medical
 Startup Business Plan
 Cyber Security
 Dashboards
 SWOT
SWOT Proposals
 Education
 Pitch Deck
 Digital Marketing
 KPIs
KPIs Project Management
 Product Management
 Artificial Intelligence
 Target Market
 Communication
 Supply Chain
 Google Slides
 Research Services
 One Pagers
 All Categories
Analytics Dashboard PowerPoint Presentation Templates and Google Slides
SHOW
- 60
- 120
- 180
DISPLAYING: 60 of 209 Item(s)
Page


Boost your confidence and team morale with this well-structured Insurance Analytics Dashboard Ppt PowerPoint Presentation Complete With Slides. This prefabricated set gives a voice to your presentation because of its well-researched content and graphics. Our experts have added all the components very carefully, thus helping you deliver great presentations with a single click. Not only that, it contains a set of tweleve slides that are designed using the right visuals, graphics, etc. Various topics can be discussed, and effective brainstorming sessions can be conducted using the wide variety of slides added in this complete deck. Apart from this, our PPT design contains clear instructions to help you restructure your presentations and create multiple variations. The color, format, design anything can be modified as deemed fit by the user. Not only this, it is available for immediate download. So, grab it now.
Presenting this set of slides with name analytics icon dashboard speedometer ppt powerpoint presentation complete deck. The topics discussed in these slides are dashboard, speedometer, key performance, business, automobile. This is a completely editable PowerPoint presentation and is available for immediate download. Download now and impress your audience.


Improve your presentation delivery using this human resource analytics dashboard employee ppt powerpoint presentation complete deck. Support your business vision and objectives using this well-structured PPT deck. This template offers a great starting point for delivering beautifully designed presentations on the topic of your choice. Comprising eleven slides this professionally designed template is all you need to host discussion and meetings with collaborators. Each slide is self-explanatory and equipped with high-quality graphics that can be adjusted to your needs. Therefore, you will face no difficulty in portraying your desired content using this PPT slideshow. This PowerPoint slideshow contains every important element that you need for a great pitch. It is not only editable but also available for immediate download and utilization. The color, font size, background, shapes everything can be modified to create your unique presentation layout. Therefore, download it now.


This is a social media management analytics dashboards powerpoint slides. This is a four stage process. The stages in this process are reach and engagement, audience profile, traffic, audience size, sentiment analysis, content analysis, competitive benchmarking, community responsiveness.\n\n\n\n\n\n


Presenting this set of slides with name sales analytics dashboard ppt powerpoint presentation outline diagrams. The topics discussed in these slides are buzz marketing, process, strategy. This is a completely editable PowerPoint presentation and is available for immediate download. Download now and impress your audience.


Presenting this set of slides with name seo strategies analytics dashboard ppt powerpoint presentation styles inspiration cpb. This is a one stage process. The stages in this process are seo strategies analytics dashboard. This is a completely editable PowerPoint presentation and is available for immediate download. Download now and impress your audience.


Deliver an awe inspiring pitch with this creative Income Assessment Report Employees Analytics Dashboard Showing Low Salary Concerns Inspiration PDF bundle. Topics like Annual Salary, Total Bonus, Paid Employee can be discussed with this completely editable template. It is available for immediate download depending on the needs and requirements of the user.


The following slide outlines key performance indicator KPI dashboard that can assist marketers to evaluate brand performance on social media channels. The metrics covered are age group, gender, brand perception, branding themes, celebrity analysis, etc. Take your projects to the next level with our ultimate collection of Brand Analytics KPI Dashboard For Organization Ppt PowerPoint Presentation Diagram PDF. Slidegeeks has designed a range of layouts that are perfect for representing task or activity duration, keeping track of all your deadlines at a glance. Tailor these designs to your exact needs and give them a truly corporate look with your own brand colors they will make your projects stand out from the rest.


The following slide outlines key performance indicator KPI dashboard that can assist marketers to evaluate brand performance on social media channels. The metrics covered are age group, gender, brand perception, branding themes, celebrity analysis, etc. Present like a pro with Market Analysis Overview And Different Categories Brand Analytics Kpi Dashboard For Organization Rules PDF Create beautiful presentations together with your team, using our easy to use presentation slides. Share your ideas in real time and make changes on the fly by downloading our templates. So whether you are in the office, on the go, or in a remote location, you can stay in sync with your team and present your ideas with confidence. With Slidegeeks presentation got a whole lot easier. Grab these presentations today.


This slide showcases dashboard of rewards and recognition. It includes elements such as total recognition given, core values, most and last impacted and total awards. Are you in need of a template that can accommodate all of your creative concepts This one is crafted professionally and can be altered to fit any style. Use it with Google Slides or PowerPoint. Include striking photographs, symbols, depictions, and other visuals. Fill, move around, or remove text boxes as desired. Test out color palettes and font mixtures. Edit and save your work, or work with colleagues. Download Employee Rewards And Recognition Analytics Dashboard Rules PDF and observe how to make your presentation outstanding. Give an impeccable presentation to your group and make your presentation unforgettable.


In this business intelligence dashboard is displayed to help company in real time monitoring and reporting of relevant details. It includes KPIs such as visits, average session duration, bounce rate, page views, traffic sources, etc. Showcasing this set of slides titled Business Intelligence And Web Analytics Dashboard To Track Marketing Kpis Inspiration PDF. The topics addressed in these templates are Goal Conversion, Track Marketing Kpis, Web Analytics Dashboard. All the content presented in this PPT design is completely editable. Download it and make adjustments in color, background, font etc. as per your unique business setting.


This slide showcases analytics and consumption software dashboard for business to keep track of their servers and downloads. It presents information related to security alerts, updates, expiring contracts, cases, etc. Showcasing this set of slides titled Analytics Dashboard To Track Server Administrators Services Demonstration PDF. The topics addressed in these templates are Expiring Contracts, Security Updates, Required. All the content presented in this PPT design is completely editable. Download it and make adjustments in color, background, font etc. as per your unique business setting.


The following slide outlines key performance indicator KPI dashboard that can assist marketers to evaluate brand performance on social media channels. The metrics covered are age group, gender, brand perception, branding themes, celebrity analysis, etc. Boost your pitch with our creative Creating Positioning Techniques For Market Research Brand Analytics Kpi Dashboard For Organization Slides PDF. Deliver an awe-inspiring pitch that will mesmerize everyone. Using these presentation templates you will surely catch everyones attention. You can browse the ppts collection on our website. We have researchers who are experts at creating the right content for the templates. So you do not have to invest time in any additional work. Just grab the template now and use them.


This slide shows the retail campaign performance highlighting the total product sales after implementing new strategies, total number of customers increased and number of new visitors in store. The best PPT templates are a great way to save time, energy, and resources. Slidegeeks have 100 percent editable powerpoint slides making them incredibly versatile. With these quality presentation templates, you can create a captivating and memorable presentation by combining visually appealing slides and effectively communicating your message. Download Retail Marketing Campaign Effective Techniques Retail Marketing Campaign Analytics Dashboard Topics PDF from Slidegeeks and deliver a wonderful presentation.


This slide showcases dashboard for website analytics that can help organization to gather data about visitors and formulate targeted marketing campaigns. It can also help to make individual and group buyer personas. If you are looking for a format to display your unique thoughts, then the professionally designed Website Analytics Dashboard For Consumer Data Insights Ppt PowerPoint Presentation File Slides PDF is the one for you. You can use it as a Google Slides template or a PowerPoint template. Incorporate impressive visuals, symbols, images, and other charts. Modify or reorganize the text boxes as you desire. Experiment with shade schemes and font pairings. Alter, share or cooperate with other people on your work. Download Website Analytics Dashboard For Consumer Data Insights Ppt PowerPoint Presentation File Slides PDF and find out how to give a successful presentation. Present a perfect display to your team and make your presentation unforgettable.


The following slide outlines key performance indicator KPI dashboard that can assist marketers to evaluate brand performance on social media channels. The metrics covered are age group, gender, brand perception, branding themes, celebrity analysis, etc. Do you have an important presentation coming up Are you looking for something that will make your presentation stand out from the rest Look no further than Market Research Assessment Of Target Market Requirements Brand Analytics Kpi Dashboard For Organization Clipart PDF. With our professional designs, you can trust that your presentation will pop and make delivering it a smooth process. And with Slidegeeks, you can trust that your presentation will be unique and memorable. So why wait Grab Market Research Assessment Of Target Market Requirements Brand Analytics Kpi Dashboard For Organization Clipart PDF today and make your presentation stand out from the rest.


This slide showcases dashboard for website analytics that can help organization to gather data about visitors and formulate targeted marketing campaigns. It can also help to make individual and group buyer personas. Want to ace your presentation in front of a live audience Our Website Analytics Dashboard For Consumer Data Insights Clipart PDF can help you do that by engaging all the users towards you.. Slidegeeks experts have put their efforts and expertise into creating these impeccable powerpoint presentations so that you can communicate your ideas clearly. Moreover, all the templates are customizable, and easy-to-edit and downloadable. Use these for both personal and commercial use.


This slide covers matrices of different channels used in digital banking to compare weekly usage by customers. It includes elements such as channel type, hourly transaction value, interaction volume and interaction value. Showcasing this set of slides titled E Banking Facility Data Analytics Dashboard Brochure PDF. The topics addressed in these templates are Interaction Value, Transaction Volume Hourly, Interaction Volume. All the content presented in this PPT design is completely editable. Download it and make adjustments in color, background, font etc. as per your unique business setting.


The following slide showcases performance key performance indicator KPI dashboard through which marketing team can measure social media campaign performance. The KPIs highlighted are YouTube channel views, Facebook daily reach, LinkedIn clicks and likes, etc. Explore a selection of the finest Comprehensive Guide To Build Marketing Marketing Analytics Dashboard To Evaluate Structure PDF here. With a plethora of professionally designed and pre-made slide templates, you can quickly and easily find the right one for your upcoming presentation. You can use our Comprehensive Guide To Build Marketing Marketing Analytics Dashboard To Evaluate Structure PDF to effectively convey your message to a wider audience. Slidegeeks has done a lot of research before preparing these presentation templates. The content can be personalized and the slides are highly editable. Grab templates today from Slidegeeks.


This slide exhibits visual report to track web performance metrics such as bounce rates, conversion rate, etc. It focuses on visualizing how effectively any website is converting traffic. It involves information related to number of users, page visitors, etc. Pitch your topic with ease and precision using this Website Analytics Dashboard To Track Business Performance Guidelines PDF. This layout presents information on Website Analytics, Dashboard To Track, Business Performance. It is also available for immediate download and adjustment. So, changes can be made in the color, design, graphics or any other component to create a unique layout.


This slide exhibits KPI to analyse consumer preferences on company sites. It aims on gaining campaign performance insights by sorting pages based on crucial metrics. It includes information related to bounce rate, number of users, etc. Showcasing this set of slides titled Website Analytics Dashboard To Analyse Customer Behaviour Themes PDF. The topics addressed in these templates are Social, Paid Search, Referral, Email, Oraganic Search. All the content presented in this PPT design is completely editable. Download it and make adjustments in color, background, font etc. as per your unique business setting.


This slide depicts the predictive analytics dashboard to track manufacturing operations, including production volume, order volume, active machines, sales revenue, top five products, downtime causes, production volume by top five machines, and so on. If you are looking for a format to display your unique thoughts, then the professionally designed Intelligent Manufacturing Predictive Analytics Dashboard To Track Manufacturing Operations Information PDF is the one for you. You can use it as a Google Slides template or a PowerPoint template. Incorporate impressive visuals, symbols, images, and other charts. Modify or reorganize the text boxes as you desire. Experiment with shade schemes and font pairings. Alter, share or cooperate with other people on your work. Download Intelligent Manufacturing Predictive Analytics Dashboard To Track Manufacturing Operations Information PDF and find out how to give a successful presentation. Present a perfect display to your team and make your presentation unforgettable.
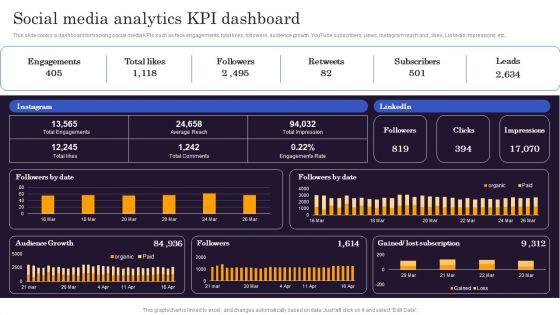
This slide covers a dashboard for tracking social media KPIs such as face engagements, total likes, followers, audience growth, YouTube subscribers, views, Instagram reach and , likes, LinkedIn impressions, etc. Find a pre designed and impeccable Marketers Guide To Data Analysis Optimization Social Media Analytics KPI Dashboard Clipart PDF. The templates can ace your presentation without additional effort. You can download these easy to edit presentation templates to make your presentation stand out from others. So, what are you waiting for Download the template from Slidegeeks today and give a unique touch to your presentation.
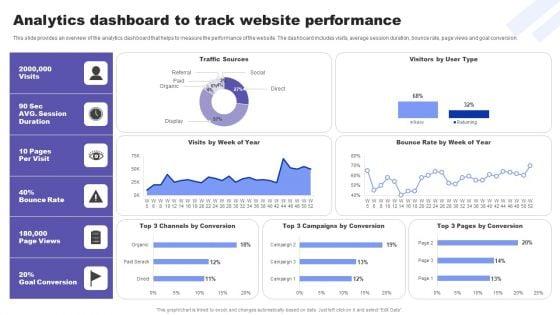

This slide provides an overview of the analytics dashboard that helps to measure the performance of the website. The dashboard includes visits, average session duration, bounce rate, page views and goal conversion. Find highly impressive Direct Response Marketing Guide Ultimate Success Analytics Dashboard To Track Mockup PDF on Slidegeeks to deliver a meaningful presentation. You can save an ample amount of time using these presentation templates. No need to worry to prepare everything from scratch because Slidegeeks experts have already done a huge research and work for you. You need to download Direct Response Marketing Guide Ultimate Success Analytics Dashboard To Track Mockup PDF for your upcoming presentation. All the presentation templates are 100 percent editable and you can change the color and personalize the content accordingly. Download now


This slide covers a dashboard for tracking social media kpis such as face engagements, total likes, followers, audience growth, youtube subscribers, views, instagram reach and , likes, linkedin impressions, etc. Find a pre-designed and impeccable Marketing Success Metrics Social Media Analytics KPI Dashboard Elements PDF. The templates can ace your presentation without additional effort. You can download these easy-to-edit presentation templates to make your presentation stand out from others. So, what are you waiting for Download the template from Slidegeeks today and give a unique touch to your presentation.


This slide shows the analysis dashboard representing the impact of social media influencers on marketing of organization products and services. It shows information related to social media followers, you tube channel views, video stats, social media conversions etc.Showcasing this set of slides titled Social Media Influencer Marketing Analytics Dashboard Ppt PowerPoint Presentation File Inspiration PDF. The topics addressed in these templates are Linkedin Engagement, Media Conversions, Facebook Engaged. All the content presented in this PPT design is completely editable. Download it and make adjustments in color, background, font etc. as per your unique business setting.


There are so many reasons you need a Social Media Analytics Dashboard To Track Viral Keywords Deploying Viral Marketing Strategies Background PDF. The first reason is you can not spend time making everything from scratch, Thus, Slidegeeks has made presentation templates for you too. You can easily download these templates from our website easily.


This slide showcases dashboard for website analytics that can help organization to gather data about visitors and formulate targeted marketing campaigns. It can also help to make individual and group buyer personas. Are you in need of a template that can accommodate all of your creative concepts This one is crafted professionally and can be altered to fit any style. Use it with Google Slides or PowerPoint. Include striking photographs, symbols, depictions, and other visuals. Fill, move around, or remove text boxes as desired. Test out color palettes and font mixtures. Edit and save your work, or work with colleagues. Download Developing Promotional Strategic Plan For Online Marketing Website Analytics Dashboard For Consumer Summary PDF and observe how to make your presentation outstanding. Give an impeccable presentation to your group and make your presentation unforgettable.


This slide showcases detailed analysis of human resources across business. It provides information such as satisfaction score, department, gender, hiring trend, designation, type, etc. Showcasing this set of slides titled Workforce Detailed Analytics Report Dashboard Mockup PDF. The topics addressed in these templates are Employees, Designation Split, Employees By Nationality. All the content presented in this PPT design is completely editable. Download it and make adjustments in color, background, font etc. as per your unique business setting.


The following slide include dashboard showing data of activities to monitor health of company, department and various processes. It covers active and complete activities, total duration, tasks and participants. Pitch your topic with ease and precision using this Procedure Analytics Data Dashboard With Business Intelligence Slides PDF. This layout presents information on Active Activities, Completed Activities, Active Tasks . It is also available for immediate download and adjustment. So, changes can be made in the color, design, graphics or any other component to create a unique layout.


This slide showcases a dashboard of analytics process to guide organizations upstream root cause and plan actions to avoid issues in future. It covers essential KPIs such as total and active process, average duration, participants, active tasks, errors, trend and summary. Showcasing this set of slides titled Analytics Procedure Dashboard With Start Trend And Summary Infographics PDF. The topics addressed in these templates are Procedure Status, Average Duration, Active Tasks. All the content presented in this PPT design is completely editable. Download it and make adjustments in color, background, font etc. as per your unique business setting.


This slide showcases dashboard for website analytics that can help organization to gather data about visitors and formulate targeted marketing campaigns. It can also help to make individual and group buyer personas. Present like a pro with Gathering Customer Website Analytics Dashboard For Consumer Data Insights Formats PDF Create beautiful presentations together with your team, using our easy-to-use presentation slides. Share your ideas in real-time and make changes on the fly by downloading our templates. So whether youre in the office, on the go, or in a remote location, you can stay in sync with your team and present your ideas with confidence. With Slidegeeks presentation got a whole lot easier. Grab these presentations today.


This slide depicts the predictive analytics dashboard to track manufacturing operations, including production volume, order volume, active machines, sales revenue, top five products, downtime causes, production volume by top five machines, and so on. This modern and well-arranged Deploying Ai To Enhance Predictive Analytics Dashboard To Track Manufacturing Guidelines PDF provides lots of creative possibilities. It is very simple to customize and edit with the Powerpoint Software. Just drag and drop your pictures into the shapes. All facets of this template can be edited with Powerpoint, no extra software is necessary. Add your own material, put your images in the places assigned for them, adjust the colors, and then you can show your slides to the world, with an animated slide included.


This slide covers a dashboard for tracking social media KPIs such as face engagements, total likes, followers, audience growth, YouTube subscribers, views, Instagram reach and , likes, LinkedIn impressions, etc. From laying roadmaps to briefing everything in detail, our templates are perfect for you. You can set the stage with your presentation slides. All you have to do is download these easy to edit and customizable templates. Optimizing Marketing Analytics To Enhance Organizational Growth Social Media Analytics KPI Dashboard Graphics PDF will help you deliver an outstanding performance that everyone would remember and praise you for. Do download this presentation today.


The following slide outlines key performance indicator KPI dashboard that can assist marketers to evaluate brand performance on social media channels. The metrics covered are age group, gender, brand perception, branding themes, celebrity analysis, etc. From laying roadmaps to briefing everything in detail, our templates are perfect for you. You can set the stage with your presentation slides. All you have to do is download these easy-to-edit and customizable templates. Comprehensive Market Research Guide Brand Analytics Kpi Dashboard For Organization Brochure PDF will help you deliver an outstanding performance that everyone would remember and praise you for. Do download this presentation today.


The given slide depicts the cyber threat analytics to track the attacks. It includes the no. of incidents, open and solved tickets, category wise no. of incidents along with malware type etc. Pitch your topic with ease and precision using this Cyber Security Incident Analytics Dashboard With Level Of Security Ppt Ideas Graphics Tutorials PDF. This layout presents information on Power Security Team, Open Incidents, Incidents Solved, Open Tickets. It is also available for immediate download and adjustment. So, changes can be made in the color, design, graphics or any other component to create a unique layout.


This slide shows the key performance metrics dashboard showing data related to HR operations of an organization. It shows key metrics such as gender diversity by business unit, headcount by seniority and age banding etc. Want to ace your presentation in front of a live audience Our Analyzing And Deploying HR Analytics Diversity Dashboard Of Enterprise Inspiration PDF can help you do that by engaging all the users towards you. Slidegeeks experts have put their efforts and expertise into creating these impeccable powerpoint presentations so that you can communicate your ideas clearly. Moreover, all the templates are customizable, and easy-to-edit and downloadable. Use these for both personal and commercial use.


This slide covers Google analytics KPI dashboard for campaign management. It also includes categories such as total users, new users count, sessions, per user session, page views, average duration, bounce rates, etc. Showcasing this set of slides titled Google Analytics Dashboard For Campaign User Information Governance Demonstration PDF. The topics addressed in these templates are Returning Visitor, New Visitor, Demographics. All the content presented in this PPT design is completely editable. Download it and make adjustments in color, background, font etc. as per your unique business setting.


This slide covers summary report on feedbacks provided by users.It includes analytics based on monthly feedbacks, positive and negative feedbacks, etc. for effective user experience. Pitch your topic with ease and precision using this User Feedback Governance And Analytics Dashboard Ppt Professional Rules PDF. This layout presents information on Current Feedbacks, Monthly Feedbacks, Analytics. It is also available for immediate download and adjustment. So, changes can be made in the color, design, graphics or any other component to create a unique layout.


This slide shows customer engagement analytical dashboard that covers total sales, total transaction, email received, links clicked, unique customer sales, sales comparison, customers name, product list. Present like a pro with Action Plan To Enhance Customer Engagement Analytical Dashboard Elements PDF Create beautiful presentations together with your team, using our easy-to-use presentation slides. Share your ideas in real-time and make changes on the fly by downloading our templates. So whether youre in the office, on the go, or in a remote location, you can stay in sync with your team and present your ideas with confidence. With Slidegeeks presentation got a whole lot easier. Grab these presentations today.
This slide represents dashboard showing analytics of performance of you tube marketing campaign. It includes data related to no. of visitors, qualified leads, customers and annual recurring revenue, lifetime value, gross volume etc generated through the campaign. Showcasing this set of slides titled You Tube Advertising Campaign Performance Analytics Dashboard Ppt Icon Diagrams PDF. The topics addressed in these templates are Monthly Recurring Revenue, Bounce Rate, Customer Churn Rate. All the content presented in this PPT design is completely editable. Download it and make adjustments in color, background, font etc. as per your unique business setting.
This slide represents the KPI dashboard to track the multiple cost associated with supply chain in food manufacturing industry. It includes information regarding cash to cash cycle in days, carry cost of inventory along with details of net sales. There are so many reasons you need a Food Processing Industry Latest Insights Trends And Analytics KPI Dashboard For Tracking Supply Chain Costs Demonstration PDF. The first reason is you can not spend time making everything from scratch, Thus, Slidegeeks has made presentation templates for you too. You can easily download these templates from our website easily.


This slide elaborates about the number of incidents that have taken place in cyber security and the malware types with per incident. It also includes the number of open and resolved ticked. Showcasing this set of slides titled Information Technology Security Team Analytics Dashboard With KPI Themes PDF. The topics addressed in these templates are Open Incidents, Resolved Incidents, Open Tickets, Resolved Tickets. All the content presented in this PPT design is completely editable. Download it and make adjustments in color, background, font etc. as per your unique business setting.


This slide shows dashboard of service department of firm to make business decisions using customer analytics and covers essential KPIs of customer. It includes request answered, revenue, support cost, customer satisfaction and retention, average time to solve issue. Showcasing this set of slides titled Business Revenue And Client Retention Analytics Dashboard Brochure PDF. The topics addressed in these templates are Customer Satisfaction, Customer Retention, Revenue. All the content presented in this PPT design is completely editable. Download it and make adjustments in color, background, font etc. as per your unique business setting.


This slide showcases dashboard for website analytics that can help organization to gather data about visitors and formulate targeted marketing campaigns. It can also help to make individual and group buyer personas. This Targeted Marketing Strategic Plan For Audience Engagement Website Analytics Dashboard For Consumer Data Insights Guidelines PDF is perfect for any presentation, be it in front of clients or colleagues. It is a versatile and stylish solution for organizing your meetings. The Targeted Marketing Strategic Plan For Audience Engagement Website Analytics Dashboard For Consumer Data Insights Guidelines PDF features a modern design for your presentation meetings. The adjustable and customizable slides provide unlimited possibilities for acing up your presentation. Slidegeeks has done all the homework before launching the product for you. So, do not wait, grab the presentation templates today.


Do you have to make sure that everyone on your team knows about any specific topic I yes, then you should give Retail Analytics Dashboard To Measure Merchandise Planning Effectiveness Designs PDF a try. Our experts have put a lot of knowledge and effort into creating this impeccable Retail Analytics Dashboard To Measure Merchandise Planning Effectiveness Designs PDF. You can use this template for your upcoming presentations, as the slides are perfect to represent even the tiniest detail. You can download these templates from the Slidegeeks website and these are easy to edit. So grab these today.


This slide shows the retail analytics dashboard to measure merchandise planning effectiveness which includes conversion rate, sell through rate, return on investment, website traffic, abandonment rate, etc. Are you searching for a Retail Analytics Dashboard To Measure Merchandise Planning Effectiveness Diagrams PDF that is uncluttered, straightforward, and original Its easy to edit, and you can change the colors to suit your personal or business branding. For a presentation that expresses how much effort you have put in, this template is ideal With all of its features, including tables, diagrams, statistics, and lists, its perfect for a business plan presentation. Make your ideas more appealing with these professional slides. Download Retail Analytics Dashboard To Measure Merchandise Planning Effectiveness Diagrams PDF from Slidegeeks today.


The following slide highlights the revenue and margin growth analytics dashboard illustrating key headings which includes revenue, gross margin, gross margin growth, monthly revenue, monthly gross margin, monthly gross margin growth, gross margin by supplier and gross margin by channel. Pitch your topic with ease and precision using this Revenue And Growth Analysis Analytics Dashboard Ppt Infographic Template Brochure PDF. This layout presents information on Monthly Revenue, Monthly Gross Margin, Gross Margin Growth. It is also available for immediate download and adjustment. So, changes can be made in the color, design, graphics or any other component to create a unique layout.


This slide represents the SAP Analytics Cloud Dashboard to Asses digital marketing campaigns performance. It provides information regarding the spend, click, impression, click through rate and cost per click summary along with details of spend by campaigns. The best PPT templates are a great way to save time, energy, and resources. Slidegeeks have 100 percent editable powerpoint slides making them incredibly versatile. With these quality presentation templates, you can create a captivating and memorable presentation by combining visually appealing slides and effectively communicating your message. Download Sap Analytics Cloud Dashboard To Asses Digital Marketing Campaigns Performance Ideas PDF from Slidegeeks and deliver a wonderful presentation.


This slide illustrates the SAP Analytics Cloud dashboard for organization income analysis and forecasting. It provides information regarding multiple incomes such as interest, operating and trading income. It also contains details of operating expenses. The best PPT templates are a great way to save time, energy, and resources. Slidegeeks have 100 percent editable powerpoint slides making them incredibly versatile. With these quality presentation templates, you can create a captivating and memorable presentation by combining visually appealing slides and effectively communicating your message. Download Sap Analytics Cloud Dashboard To Asses Digital Marketing Campaigns Performance Ideas PDF from Slidegeeks and deliver a wonderful presentation.


This slide illustrates the SAP Analytics Cloud dashboard to monitor product sales performance. It provides information regarding the gross margin and net revenue earned, product performance state wise and year wise. Welcome to our selection of the Budget Plan For BI Technique For Data Informed Decisions Clipart PDF. These are designed to help you showcase your creativity and bring your sphere to life. Planning and Innovation are essential for any business that is just starting out. This collection contains the designs that you need for your everyday presentations. All of our PowerPoints are 100 percent editable, so you can customize them to suit your needs. This multi purpose template can be used in various situations. Grab these presentation templates today.


This slide represents the SAP Analytics Cloud Dashboard for HR department of the organization. It includes information regarding the workforce employed, average salary department wise, age diversity, gender distribution and reasons for leaving firm. This modern and well-arranged BI Technique For Data Informed Decisions Sap Analytics Cloud Dashboard For HR Department Background PDF provides lots of creative possibilities. It is very simple to customize and edit with the Powerpoint Software. Just drag and drop your pictures into the shapes. All facets of this template can be edited with Powerpoint no extra software is necessary. Add your own material, put your images in the places assigned for them, adjust the colors, and then you can show your slides to the world, with an animated slide included.


This slide illustrates the SAP Analytics Cloud dashboard for financial reporting in terms of net revenue, operating profit, cost of goods sold, profitability trend and net revenue by country. It also provides details of net worth of incoming order and order distribution by country. Coming up with a presentation necessitates that the majority of the effort goes into the content and the message you intend to convey. The visuals of a PowerPoint presentation can only be effective if it supplements and supports the story that is being told. Keeping this in mind our experts created BI Technique For Data Informed Decisions Sap Analytics Cloud Dashboard For Financial Reporting Portrait PDF to reduce the time that goes into designing the presentation. This way, you can concentrate on the message while our designers take care of providing you with the right template for the situation.


This slide shows the retail analytics dashboard to measure merchandise planning effectiveness which includes conversion rate, sell through rate, return on investment, website traffic, abandonment rate, etc. Make sure to capture your audiences attention in your business displays with our gratis customizable Retail Analytics Dashboard To Measure Merchandise Planning Effectiveness Microsoft PDF. These are great for business strategies, office conferences, capital raising or task suggestions. If you desire to acquire more customers for your tech business and ensure they stay satisfied, create your own sales presentation with these plain slides.
SHOW
- 60
- 120
- 180
DISPLAYING: 60 of 209 Item(s)
Page